
 |
 |
 |
 |
 |
Artigo
| Raman spectroscopy: a study of the vibrational spectra of hydroxybenzoic acid isomers |
|
Shaoliang ShiI,#; Shan TuII,III,#,* I. China Academy of Science and Technology Development Guangxi Branch, 534000 Nanning, China Received: 12/18/2024 *e-mail: ts@mailbox.gxnu.edu.cn; glietzwt@163.com In this study, the Raman spectra of ortho-hydroxybenzoic acid (O-HA), meta-hydroxybenzoic acid (M-HA), and para-hydroxybenzoic acid (P-HA) molecules were recorded in the Raman shift range of 200-800 cm-1 using the Raman time domain spectroscopy (R-TDS) technique. The characteristic Raman scattering peaks of these three isomers of hydroxybenzoic acid were obtained, and it was found that there are significant differences in peak frequencies between O-, M-, and P-HA. Concurrent with the experimental study, theoretical calculations were performed on the molecular crystal cell of hydroxybenzoic acid using density functional theory (DFT), simulating the experimental Raman spectral features, and the results were in good agreement with the experimental data. The potential energy distribution (PED) is employed to examine the distinct vibrational modes of O-, M-, and P-HA molecules, as well as to assess the contribution of these various vibrational modes to the overall potential energy. The results indicate that R-TDS can distinguish the subtle differences between chiral isomers of hydroxybenzoic acid. The significance of this research lies not only in the scientific insights it provides but also in its practical implications for material science, pharmaceuticals, environmental monitoring, and forensic science, where the accurate identification and characterization of materials are of paramount importance. INTRODUCTION Hydroxybenzoic acid isomers, including ortho-hydroxybenzoic acid (O-HA), meta-hydroxybenzoic acid (M-HA), and para- hydroxybenzoic acid (P-HA), along with their corresponding benzoate ions or salts, have a wide range of applications in biology, nanotechnology, medicine, and drug delivery.1 They are structural isomers that share the same bonding pattern but maintain different geometrical positions of the atoms involved in space, and they do not necessarily exhibit similar properties even with the same functional groups, which may differ significantly in terms of drug efficacy, pharmacological potency, and physiological effects. For example, when the hydroxyl group (-OH) in hydroxybenzoic acid is replaced by a substituent on the benzene ring, leading to the absence of a plane of symmetry within the molecule, its physical, chemical, and biological properties can change significantly. Therefore, understanding their isomeric behavior is essential for grasping chemical reactivity and other structural aspects. Raman spectroscopy has emerged as a powerful analytical tool in the field of materials science, offering a non-destructive and highly sensitive approach for detecting materials, characterizing their composition, and identifying structural changes.2-4 This technique is typically based on the inelastic scattering of monochromatic light from lasers, which allows for the identification of molecule-specific vibrational modes. One of the most compelling applications of Raman spectroscopy is its ability to detect and analyze subtle structural changes within materials. These changes, which can be observed in real time, may indicate phase transitions, degradation processes, or the formation of new chemical bonds, providing valuable insights into the dynamic behavior of a material under various conditions.5,6 In addition, Raman spectroscopy plays a crucial role in distinguishing isomers, as the physical and chemical properties of isomeric polymers are significantly influenced by their molecular structures. It is important to note that the differentiation between isomers is not limited to structural isomers; it also extends to stereoisomers and conformational isomers. This versatility further underscores the capability of Raman spectroscopy in addressing complex chemical challenges.7-9 Vibrational spectroscopy is a widely employed technique for the structural characterization of molecular systems.10 In this context, density functional theory (DFT), potential energy distribution (PED) analysis, and Raman spectroscopy work synergistically to enhance the study of molecular vibrational spectra and material properties. DFT, as a quantum mechanical method, is extensively utilized to calculate the electronic structure of many-body systems, thereby enabling the effective prediction of ground state properties of molecules and their vibrational spectra. By accurately determining the electron density, DFT offers theoretical insights into the vibrational modes of molecules. However, further analysis is often necessary to unravel the intricate details of the internal motion within these molecular structures.11,12 PED analysis serves as a valuable complement to the results obtained from DFT calculations. PED enables researchers to identify and elucidate vibrational behaviors by visualizing the vibrational modes of molecules, thereby enhancing the understanding of the relationship between molecular structure and properties. By integrating DFT and PED, researchers can systematically explore the vibrational properties of molecules from a quantum mechanical perspective.13 In contrast, Raman spectroscopy, as an experimental technique, offers a direct means to probe the vibrational modes and chemical environments of isomeric molecules. By leveraging the results of DFT and PED calculations, researchers can predict the Raman activity patterns and frequencies of isomers, allowing for comparison with experimental data. This not only facilitates the validation of the theoretical model but also offers deeper insights into Raman spectroscopy experiments. Consequently, the integration of DFT, PED analysis, and Raman spectroscopy forms a robust research tool for characterizing and understanding of the properties of heterostructured materials. Yao et al.14 probed three optical isomers of astaxanthin (AST) using Raman spectroscopy. The Raman spectra of the three isomers were found to have different intensities at 1190 and 1215 cm-1. The spectral differences were analyzed using DFT. The main occupied conformations of the three optical isomers were speculated and characterized. Gutiérrez-Quintanilla et al.15 studied the enol form of trifluoroacetylacetone (TFacac) isolated from molecules and rare gas matrices using infrared spectroscopy and Raman spectroscopy combined with DFT theoretical calculations, as well as the presence of multiple stable enol form isomers of TFacac. Kutovyy et al.16 obtained experimental vibrational spectra, encompassing both Raman and infrared absorption spectra, of quercetin microcrystalline powder within the spectral range of 400 to 1800 cm-1 at room temperature. The optimized geometries for the two stable isomers of the quercetin molecule were computed using the density functional method at the CAM B3LYP/6-311++G(d, p) level. The vibrational spectra were analyzed across the entire frequency range examined. A strong correlation exists between the experimentally and computationally derived vibrational spectra. Chen et al.17 employed DFT to calculate the Raman spectra of 40 significant perfluoroalkyl substances (PFAS) enumerated in the United States Environmental Protection Agency (US EPA) Draft 1633.18 A systematic comparison of their spectral characteristics was conducted, with the identification of Raman peaks and vibrational modes. The findings indicate that the integration of Raman spectroscopy with sophisticated spectral analysis techniques can effectively differentiate among various PFAS compounds. This capability is highly valuable for enhancing the detection and characterization methodologies pertinent to PFAS. Han et al.19 demonstrated through X-ray photoelectron spectroscopy, Raman spectroscopy, photoluminescence spectroscopy, and theoretical calculations that the chemical functionalization of defective monolayers of MoS2 can be discerned through the isomers by field effect transistors. This approach enables the precise identification of these materials. Novikov et al.20 used the DFT to calculate the structures and Raman spectra of the trans isomers of α-, β-, γ-carotene, and lycopene, along with modified versions of β-carotene and lycopene where the terminal or side groups were substituted. Additionally, the study encompassed an analysis of the partial covalent bond stretching properties and the extent of conjugation within these molecules. In this study, Raman spectra of O-HA, M-HA, and P-HA were recorded within the Raman shift range of 200-1800 cm-1. Concurrently, the molecular structure of hydroxybenzoic acid was calculated theoretically using DFT to simulate the experimental features of Raman spectrum. Furthermore, the distinct vibrational modes of O-HA, M-HA, and P-HA were examined using potential PED analysis, allowing the evaluation of the contribution of each vibrational mode to the overall potential energy. The findings demonstrate that Raman spectroscopy can effectively differentiate subtle variations among the chiral isomers of hydroxybenzoic acid. The results of this study hold practical significance in the fields of materials science, pharmaceuticals, environmental monitoring, and forensic science.
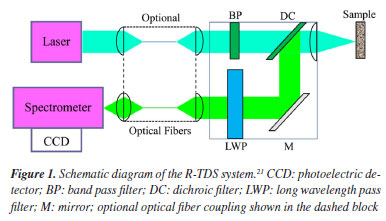
METHODOLOGY Experimental apparatus The portable Raman spectrometer (Avantes, 240 × 140 × 250 mm) is shown in Figure 1. The system consists of a semiconductor laser, a spectrometer, a Raman fiber probe, excitation and collection fibers, a computer, a sample cell, and a data processing system. The key specifications include an excitation source of 785 nm, a spectral range of 100-3500 cm-1, a resolution of 6 cm-1, an integration time of 1.1 ms to 10 min, a maximum output power of 500 mW, and an operating temperature range of 10-40 ºC. In the Raman measurement system, the laser is emitted and guided through the excitation fiber to the probe, where it irradiates the sample. The sample is excited to produce a Raman signal, which is collected by the probe and transmitted through the collection fiber to the spectrometer. The spectrometer disperses the signal, and a charge-coupled device (CCD) detector captures the light intensity at each pixel. The signal is then converted by an analog-to-digital (A/D) converter, transmitted to the computer via the input/output (I/O) interface, and finally processed to display the Raman spectrum.
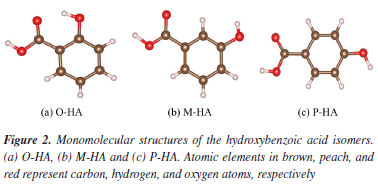
Sample The O-, M-, and P-HA samples used in this study were sourced from Shanghai Aladdin Biochemical Technology Co., Ltd. The molecular formulas of these hydroxybenzoic acids are presented in Figure 2. The purity of O-HA, M-HA and P-HA was 99.5, 98.0 and 99.0%, respectively.
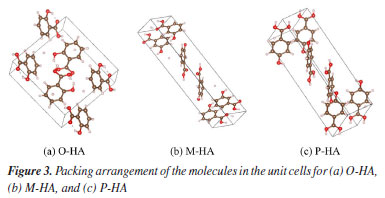
Raman spectroscopy data acquisition A portable Raman spectrometer was used in this experiment.22 The light source was a 785 nm near-infrared laser.23 The laser energy was set to 200 mW and the integration time was set to 10 times the standard time (15 s), which were chosen to optimize the Raman peak intensity. The air spectrum was used as a blank reference and measured at room temperature. The samples were then loaded into a cuvette without fluorescent background. The cuvette was scanned in a darkroom at a set focal length. Each sample was scanned three times consecutively and the average spectrum was then obtained from these three scans. This study focuses on selecting suitable fitting data points from the spectra, then determining the fitting order that matches the spectral characteristics, and finally using the principle of least squares to calculate the best approximation function for these data points for the five-nominal fitting baseline correction.24 Count DFT method The most common application of DFT is realized through the Kohn-Sham method, with the simplest approximate solution being the local density approximation (LDA).25,26 This method is widely employed in calculations pertaining to solid-state physics. In the majority of cases, DFT provides results that are highly satisfactory when compared to other methods for solving quantum mechanical many-body problems. Configuration searches for the O-, M-, and P-HA molecules were conducted using data sourced from the Cambridge Crystallographic Data Centre (CCDC) database.27 The resonance spectrum of a single molecule calculated using DFT often results in a horizontal line. Consequently, a protocell comprising multiple molecules was selected for simulation calculations. After numerous calculations and screening steps, a seven-molecule unit cell was ultimately established, as depicted in Figure 3. The Becke-3-Lee-Yang-Parr combined with dispersion correction (B3LYP-D3) method was chosen (basis set 6-311G(d, p)) to conduct the studies.28 The simulation experiments were conducted using Gaussian 16 (version Windows, Gaussian, Inc., Wallingford, CT, USA).
PED method The potential energy distribution (PED) analysis method is a technique designed to disentangle these vibrational modes. This method allows for the determination of the contribution of each feature group to the vibrational modes. For instance, hydroxyl and carboxyl groups will display vibrational patterns such as symmetric stretching, wiggling, and symmetric bending. By examining the percentage contributions of these groups, it facilitates a more profound comprehension of the properties of the normal vibration modes. The PED analysis can provide the percentage contribution of each feature group to the normal vibration modes.29 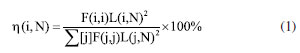 where F represents the force constant matrix, L denotes the eigenvector matrix of F, and the N column represents the N simple positive vibration vector. Consequently, the collective molecular vibration patterns of the O-, M-, and P-HA molecules can be elucidated through the findings derived from the study of PED.
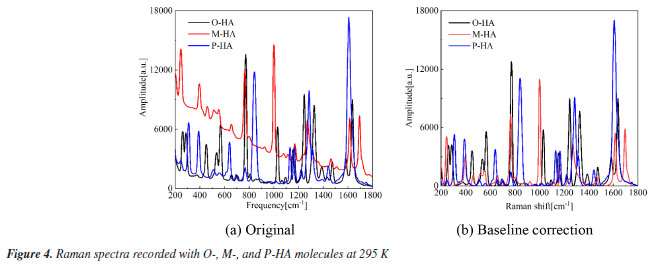
RESULTS AND DISCUSSION The Raman spectra of HAs The Raman spectra of the three samples obtained are shown in Figure 4. The samples were found to shift in the frequency range of 200-1800 cm-1. Figure 4a presents the source Raman shift spectra of the three HA isomers, revealing that each of the three spectra exhibited a notably severe baseline drift. Such drifts could adversely impact the subsequent theoretical spectral assignments. To address this issue, the raw absorbance spectra underwent a 5th order polynomial baseline correction, as depicted in Figure 4b. Despite the presence of some overlapping or close spectral scattering peaks, the Raman spectral scattering peaks of the three samples were markedly different from each other. The findings indicated that the HA isomers, which share the same molecular weight and possess similar structures but vary in the positions of the hydroxyl groups on the benzene ring, display distinctly different scattering properties. This approach also offers a novel technical avenue for the identification of the three samples.
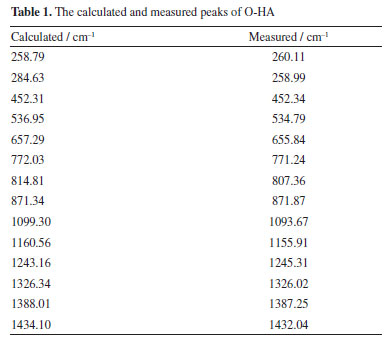
The simulated Raman spectra of HA isomers Figure 5 presents the comparison between the experimental spectra of O-HA and the DFT simulated spectra of the O-HA cluster molecules. The correspondence between the calculated and measured peaks is shown in Table 1.
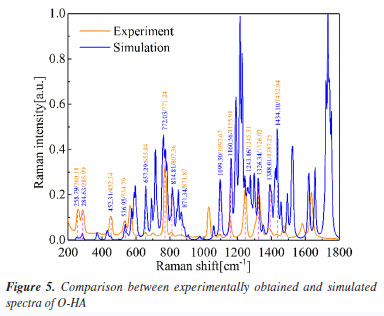
It is important to note that the peak at 1055.91 cm-1 in the measured spectrum does not have a corresponding calculated peak listed. Additionally, the calculated peak at 1160.56 cm-1 may correspond to the measured peak at 1155.91 cm-1, indicating a slight discrepancy between the calculated and experimental values. This comparison underscores the importance of experimental validation in theoretical modeling and the overall agreement between the two sets of data. Figure 6 presents the comparison between the experimental spectra of M-HA and the DFT simulated spectra of the M-HA cluster molecules. The correspondence between the calculated and measured peaks is shown in Table 2.
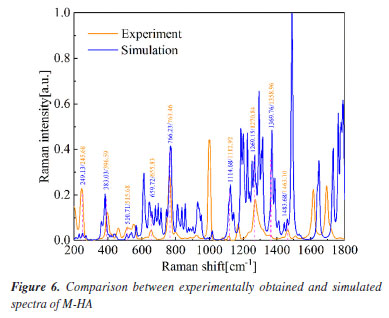
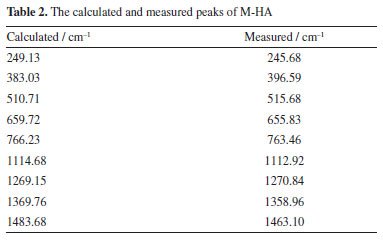
It is worth noting that the calculated peaks at 383.03, 1369.76 and 1483.68 cm-1 may correspond to the measured peaks at 396.59, 1358.96 and 1463.10 cm-1, respectively. The calculated peak at 1483.68 cm-1 may correspond to the measured peak at 1463.10 cm-1. It shows that the calculated values are somewhat different from the experimental values. This comparison demonstrates the importance of experimental validation in theoretical modeling as well as the general agreement between the two data sets, highlighting the effectiveness of DFT in predicting the vibrational modes of M-HA. Figure 7 presents the comparison of the experimental Raman spectra obtained for P-HA with the DFT simulated spectra of the P-HA cluster molecules. The correspondence between the calculated and measured peaks is shown in Table 3.
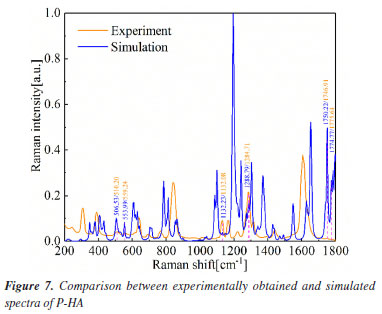
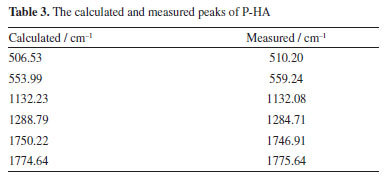
This comparison demonstrates the consistency between the theoretical predictions and experimental observations, indicating the reliability of the DFT method in simulating the vibrational modes of P-HA. The slight differences in peak positions reflect the complexity of molecular interactions and the approximations inherent in computational models. It is presumed that the thermal impact on the samples is minimal. In the spectra depicted in Figures 5-7, there are only a few peak sites where the experimentally obtained spectra deviate from the calculated spectra. These variations can be ascribed to the approximations inherent in the dynamic simulation calculations of the O-, M-, and P-HA molecules conducted under DFT, as well as minor discrepancies between the cluster molecular model and the actual molecular structure of the samples. Experiments were conducted at a temperature of 295 K, yielding comparable outcomes.30 Experimental results are frequently influenced by systematic (or instrumental) errors and environmental noise, which can stem from fluctuations in electrical power, alterations in the vibrational state of the surroundings, and variations in atmospheric pressure. Analysis of the vibrational modes Table 4 presents the conclusive assignments of the vibrational modes, enumerating the distinctive vibrational modes associated with the Raman peaks for the O-, M-, and P-HA molecular cluster systems. The visualization of these vibrational modes was facilitated by the use of GaussView software.31 Figures 8-10 illustrate representative modes that were selected from the dynamic vibrational modes to capture a specific frame. Each vibrational mode is thoroughly described in this section. The observation that the O-, M-, and P-HA isomers, despite having the same molecular formula, display distinct Raman shift peaks, underscores the potential of the R-TDS technique for the identification of structurally analogous organic molecules.
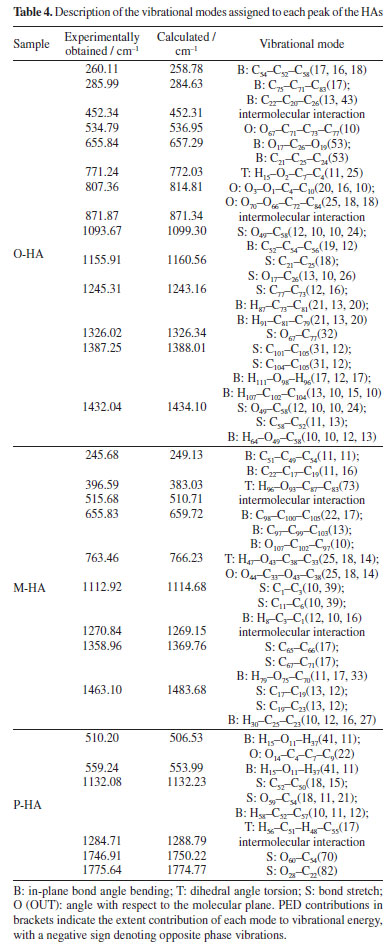
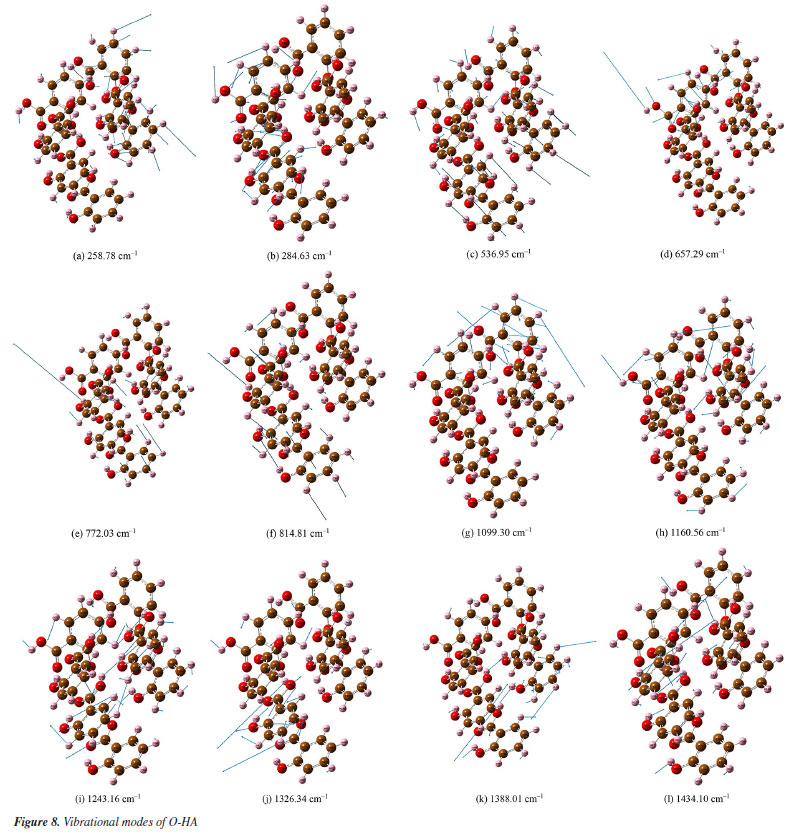
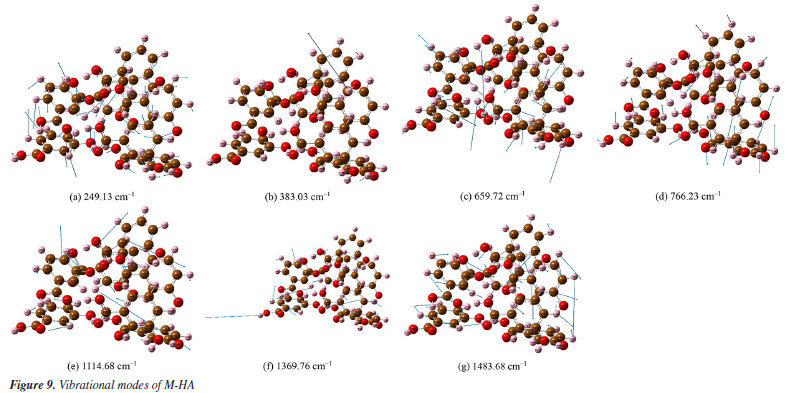
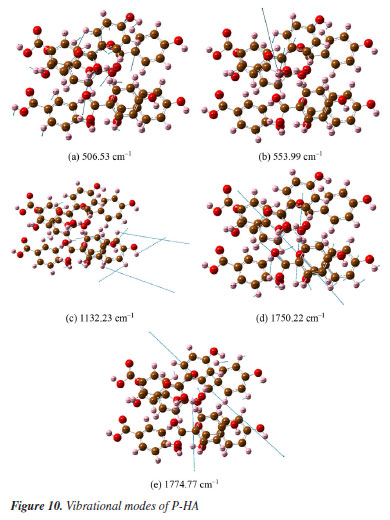
Figures 8a-8l presents a comprehensive illustration of the vibrational modes for the O-HA clusters corresponding to specific Raman shift peaks. The analysis of these modes, along with the data from Table 4, provides a detailed understanding of the vibrational behavior of the O-HA cluster. The mode at 258.78 cm-1 is primarily attributed to the in-plane bond angle bend of the C54C52C58 atoms. The peak at 284.63 cm-1 is mainly influenced by the in-plane bond angle bends of C75C71C83 and C22C20C26 atoms. The peak at 536.95 cm-1 is characterized by the angle between the vector and the plane involving O67C71C73C77 atoms. The 657.29 cm-1 peak is influenced by in-plane bond angle bends of O17C26O19 and C21C25C24 atoms. The 772.03 cm-1 peak is dominated by dihedral angle torsion and bond length stretch involving H15O2C7C4 atoms. At 814.81 cm-1, the mode is influenced by the angle between vectors of O3O1C4C10 and O70O66C72C84 atoms. The peak at 1099.30 cm-1 is primarily a bond length stretch of O49C58 atoms and an in-plane bond angle bend of C52C54C56 atoms. The peak at 1160.56 cm-1 is influenced by the bond length stretch of C21C25 and O17C26 atoms. The peak at 1243.16 cm-1 shows influence from the bond length stretch of C77C73 atoms and in-plane bond angle bend of H87C73C81 and H91C81C79 atoms. The peak at 1326.34 cm-1 is mainly a bond length stretch of O67C77 atoms. The peak at 1388.01 cm-1 is influenced by bond length stretches of C101C105 and C104C105 atoms and an in-plane bond angle bend of H111O98H96 and H107C102C104 atoms. Finally, the peak at 1434.10 cm-1 is characterized by bond length stretches of O49C58 and C58C52 atoms and an in-plane bond angle bend of H64O49C58 atoms. The blue arrows in Figures 8a-8l denote the direction of torsion. These findings, along with the results from Table 4, reveal distinct Raman shift peaks for the O-, M-, and P-HA isomers, which is fundamental for the identification of structurally similar organic molecules using the R-TDS technique. Figures 9a-9g presents the vibrational modes of the M-HA clusters corresponding to the Raman shift peaks at 249.13, 383.03, 659.72, 766.23, 1114.68, 1369.76, and 1483.68 cm-1. The blue arrows indicate the direction of torsion, aiding in the visualization of these modes. The vibrational mode at 249.13 cm-1 is primarily due to in-plane bond angle bends involving the C51C49C54 and C22C17C19 atoms. At 383.03 cm-1, the mode is mainly influenced by dihedral angle torsion involving the H96O93C87C83 atoms. The modes of the peak at 659.72 cm-1 are influenced by in-plane bond angle bends involving the O67C71C73C77, C98C100C105, and O107C102C97 atoms. The modes of the peak at 766.23 cm-1 are influenced by dihedral angle torsion involving the H47O43C38C33 atoms and the angle between the vector and the plane involving the O44C33O43C38 atoms. The modes at 1114.68 cm-1 are primarily influenced by bond length stretches involving the C1C3 and C11C6 atoms and in-plane bond angle bends involving the H8C3C1 atoms. The modes of the peak at 1369.76 cm-1 are mainly due to bond length stretches involving the C65C66 and C67C71 atoms and in-plane bond angle bends involving the H79O75C70 atoms. Lastly, the modes at 1483.68 cm-1 are influenced by bond length stretches involving the C17C19 and C19C23 atoms and in-plane bond angle bends involving the H30C25C23 atoms. These detailed observations, corroborated by the data in Table 4, offer insights into the vibrational characteristics of the M-HA cluster, essential for distinguishing it from its isomers in structural analysis. Figures 10a-10e presents a series of vibrational modes for the P-HA clusters that correspond to the Raman shift peaks at 506.53, 553.99, 1132.23, 1750.22, and 1774.77 cm-1. The blue arrows in the figures delineate the direction of torsion, aiding in the visualization of the vibrational motions. At the 506.53 cm-1 peak, the vibrational mode is primarily attributed to the in-plane bond angle bend involving the H15O11H37 atoms and the angle between the vector and the plane involving the O14C4C7C9 atoms. The modes of the peak at 553.99 cm-1 are predominantly influenced by the in-plane bond angle bend of the H15O11H37 atoms. For the peak at 1132.23 cm-1, the modes are shaped by the bond length stretch involving the C52C50 and O59C54 atoms, the in-plane bond angle bend of the H58C52C57 atoms, and the dihedral angle torsion of the H56C51H48C55 atoms. The modes of the peak at 1750.22 cm-1 are mainly influenced by the bond length stretch involving the O60C54 atoms. Lastly, the modes of the peak at 1774.77 cm-1 are primarily affected by the bond length stretch involving the O28C22 atoms. The comprehensive analysis of these modes, corroborated with the data from Table 4, provides a clear picture of the vibrational characteristics of the P-HA cluster, essential for distinguishing it from other structurally similar molecules.
CONCLUSIONS This study effectively utilized Raman time-domain spectroscopy to distinguish among the three positional isomers of hydroxybenzoic acid (O-HA, M-HA, and P-HA). The distinct characteristic peaks observed in the Raman spectra act as definitive fingerprints for each isomer, highlighting the efficacy of the method in molecular recognition. Our findings not only confirm the accuracy of vibrational mode simulations for the hydroxylbenzoic acid molecules performed using DFT-based quantum chemical calculations, but also highlight the potential of Raman spectroscopy in investigating the isomerization processes of these organic compounds. The results gained from this research elucidate the mechanisms underlying the formation of Raman characteristic peaks specific to hydroxylbenzoic acid at the molecular level. This has significant implications for various applications, especially in the pharmaceutical industry, where a deeper understanding of the chemical properties of substances can facilitate the design and development of improved drugs. Looking ahead, future research could focus on broadening this approach to include other organic compounds and investigating the impact of varying environmental conditions on spectral results. Moreover, integrating Raman spectroscopy with other analytical techniques may further enrich our understanding of molecular interactions and properties.
DATA AVAILABILITY STATEMENT Data will be made available on request.
ACKNOWLEDGMENTS This study was funded by Guangxi Natural Science Foundation of China (grant No. 2024GXNSFBA010197 and 2025GXNSFAA069527) and was partially supported by Guangxi Key Research and Development Program of China (grant No. Guike AB22035047), Central Government Guidance Funds for Local Scientific and Technological Development of China (grant No. Guike ZY22096024), Guangxi Key Laboratory of Optoelectronic Information Processing Open Foundation of China (grant No. GD22203), National Natural Science Foundation of China (grant No. 62405068 and 61965005), Guangxi University Young and Middle-aged Teachers Research Basic Ability Improvement Project of China (grant No. 2024KY0068 and 2024KY0217).
AUTHOR CONTRIBUTIONS Shaoliang Shi was responsible for software, writing original draft; Shan Tu for conceptualization, methodology, software; Wentao Zhang for software, supervision, writing (review and editing); Song Yang for data curation; Hao Du for formal analysis; Yuanpeng Li for data curation, validation; Junhui Hu for investigation, software; Huapeng Xiao for visualization.
REFERENCES 1. Perry, D.; Boucher, J.; Posey, K.; Cordova, S.; Smith, L.; Son, H. J.; Pandey, R.; Biris, A. S.; Spectrochim. Acta, Part A 2009, 74, 104. [Crossref] 2. Wen, B. Y.; Wang, A.; Lin, J. S.; Guan, P. C.; Radjenovic, P. M.; Zhang, Y. J.; Tian, Z. Q.; Li, J. F.; Small Methods 2021, 5, 2000993. [Crossref] 3. Wang, Y.; Guan, M.; Mi, F.; Geng, P.; Chen, G.; Anal. Chim. Acta 2023, 1272, 341523. [Crossref] 4. Ye, Y.; Yi, W.; Liu, W.; Zhou, Y.; Bai, H.; Li, J.; Xi, G.; Sci. China Mater. 2020, 63, 794. [Crossref] 5. Zhang, Y.; Yang, B.; Ghafoor, A.; Zhang, Y.; Zhang, Y. F.; Wang, R. P.; Yang, J. L.; Luo, Y.; Dong, Z. C.; Hou, J. G.; Natl. Sci. Rev. 2019, 6, 1169. [Crossref] 6. Salke, N. P.; Rao, R.; Deng, J.; Xing, X.; AIP Conf. Proc. 2013, 1512, 106. [Crossref] 7. Lin, Z.; Guo, X.; He, Z.; Liang, X.; Wang, M.; Jin, G.; Polym. Eng. Sci. 2021, 61, 201. [Crossref] 8. Shi, G.; Xie, Y.; Du, L.; Fu, X.; Chen, X.; Xie, W.; Wang, M.; Angew. Chem. 2022, 134, e202203569. [Crossref] 9. Zhang, X. Y.; Zhao, Y. R.; Li, H. X.; Cheng, K. G.; Liu, Z. R.; Liu, Z. P.; He, H.; Chin. Phys. B 2023, 32, 066102. [Crossref] 10. Kaya, M. F.; Parlak, C.; Keşan, G.; Alver, Ö.; Tursun, M.; Spectrochim. Acta, Part A 2013, 113, 1. [Crossref] 11. te Vrugt, M.; Löwen, H.; Wittkowski, R.; Adv. Phys. 2020, 69, 121. [Crossref] 12. Graziotto, L.; Macheda, F.; Sohier, T.; Calandra, M.; Mauri, F.; Phys. Rev. B 2024, 109, 420. [Crossref] 13. Jamróz, M. H.; Spectrochim. Acta, Part A 2013, 114, 220. [Crossref] 14. Yao, G.; Guo, S.; Yu, W.; Muhammad, M.; Liu, J.; Huang, Q.; Spectrochim. Acta, Part A 2021, 262, 120143. [Crossref] 15. Gutiérrez-Quintanilla, A.; Platakyte, R.; Chevalier, M.; Crépin, C.; Ceponkus, J.; J. Phys. Chem. A 2021, 125, 2249. [Crossref] 16. Kutovyy, S.; Savchuk, R.; Bashmakova, N.; Stanovyi, O.; Palchykivska, L.; Ukr. J. Phys. Opt. 2021, 22, 181. [Crossref] 17. Chen, Y.; Yang, Y.; Cui, J.; Zhang, H.; Zhao, Y.; J. Hazard. Mater. 2024, 465, 133260. [Crossref] 18. United States Environmental Protection Agency (US EPA); Draft Method 1633: Analysis of Per- and Polyfluoroalkyl Substances (PFAS) in Aqueous, Solid, Biosolids, and Tissue Samples by LC-MS/MS; US EPA: Washington, 2021. [Link] accessed in June 2025 19. Han, B.; Gali, S. M.; Dai, S.; Beljonne, D.; Samorì, P.; ACS Nano 2023, 17, 17956. [Crossref] 20. Novikov, V. S.; Kuzmin, V. V.; Darvin, M. E.; Lademann, J.; Sagitova, E. A.; Prokhorov, K. A.; Ustynyuk, L. Y.; Nikolaeva, G. Y.; Spectrochim. Acta, Part A 2022, 270, 120755. [Crossref] 21. Tu, S.; Zhang, W.; Li, Y.; Tang, Y.; Hu, J.; Xiao, H.; J. Mol. Struct. 2024, 1312, 138587. [Crossref] 22. Zhang, S.; Xu, J.; He, M.; Sun, Z.; Li, Y.; Ding, L.; Wu, L.; Liu, X.; Du, Z.; Jiang, S.; Spectrochim. Acta, Part A 2024, 315, 124300. [Crossref] 23. Hara, R.; Ishigaki, M.; Kitahama, Y.; Ozaki, Y.; Genkawa, T.; Food Chem. 2018, 258, 308. [Crossref] 24. Cowger, W.; Steinmetz, Z.; Gray, A.; Munno, K.; Lynch, J.; Hapich, H.; Primpke, S.; Frond, H. D.; Rochman, C.; Herodotou, O.; Anal. Chem. 2021, 9, 7543. [Crossref] 25. Bagayoko, D.; AIP Adv. 2014, 4, 127104. [Crossref] 26. Zhao, G. L.; Bagayoko, D.; Williams, T. D.; Phys. Rev. B 1999, 60, 1563. [Crossref] 27. Groom, C. R.; J. Chem. Inf. Model. 2011, 51, 2787. [Crossref] 28. Kołodziejczyk, E.; Lewańska, M.; Malik, M.; Morzyk-Ociepa, B.; J. Mol. Struct. 2023, 1294, 136489. [Crossref] 29. Jamróz, M. H.; Ostrowski, S.; Dobrowolski, J. C.; Spectrochim. Acta, Part A 2015, 149, 463. [Crossref] 30. Ma, J. L.; Xu, K.; J.; Li, Z.; Jin, B. B.; Fu, R.; Zhang, C. H.; Ji, Z. M.; Zhang, C.; Chen, Z. X.; Chen, J.; Wu, P. H.; Acta Phys. Sin. 2009, 58, 6101. [Crossref] 31. Premkumar, S.; Jawahar, A.; Mathavan, T.; Dhas, M. K.; Sathe, V. G.; Benial, A. M. F.; Spectrochim. Acta, Part A 2014, 129, 74. [Crossref]
#Shaoliang Shi and Shan Tu are co-first authors of the article. |

On-line version ISSN 1678-7064 Printed version ISSN 0100-4042
Química Nova
Publicações da Sociedade Brasileira de Química
Caixa Postal: 26037
05513-970 São Paulo - SP
Tel/Fax: +55.11.3032.2299/+55.11.3814.3602
Free access