
 |
 |
 |
 |
 |
Artigo
| Comparison between methodologies for the calculation of kinetic triplet for the pyrolysis of heterogeneous biomass (sunflower seed husks) |
|
Arthur T. F. A. AraújoI; Nádia G. SousaII; Cássia R. CardosoIII; Daniel A. CerqueiraIV,* I. Programa de Pós-Graduação Multicêntrico em Química do Estado de Minas Gerais, Universidade Federal do Triângulo Mineiro, 38064-200 Uberaba - MG, Brasil Received: 10/03/2024 *e-mail: daniel.cerqueira@uftm.edu.br The pyrolytic kinetics of sunflower seed husks (SSH) are investigated based on previous activation energy data. By applying the kinetic compensation effect (KCE), the average value of the frequency factor was 3.517 × 10⁹ s-1. Through the numerical reconstruction, the two-dimensional reaction model, based on diffusion phenomena, [-ln(1 - α)]-1, best represented the pyrolysis of SSH; where α is the mass conversion of the material. The calculated kinetic parameters efficiently predicted experimental kinetic behavior since they presented lower deviations, with a maximum magnitude of 6%. These results indicated that the proposed methodology was suitable to describe the pyrolysis of SSH. This work is the first study on the kinetic triplet for the pyrolysis of heterogeneous biomass (SSH) using the KCE, with the construction of theoretical curves and the comparison with master plots methodology. INTRODUCTION The main objective of the kinetic analysis of solid-state reactions, such as the pyrolysis of lignocellulosic biomass, is to determine the kinetic triplet parameters, which include apparent activation energy, frequency factor, and reaction model (conversion function). These parameters are relevant for understanding the pyrolytic reaction and formulating its mathematical representation. This enables the design, operation, and modification of pyrolysis processes on a larger scale. It also facilitates the feasibility assessments and the utilization of various biomasses as raw materials in thermochemical conversion processes.1,2 Each kinetic triplet parameter is associated with some fundamental theoretical concept. The frequency factor (A) is based on collision theory and provides several collisions that occur in the reaction per time. The activation energy (E) is the minimum energy that must be overcome to initiate the reaction. The reaction model (f(α)) corresponds to a mathematical representation of the conversion process throughout the extent of reaction.3-5 Thermogravimetry (TG) is the main technique applied to investigate the thermal degradation of solids and their reaction kinetics. This technique measures the decrease in solid mass during thermal degradation as a function of temperature or time caused by the release of volatiles or devolatilization. Since TG is a simple and high-precision process, it can provide valuable information on the pyrolysis of lignocellulosic biomass.2,6 Mathematical methods with different levels of complexity have been developed to describe pyrolysis kinetics using TG. These mathematical methods include the independent parallel reactions model (IPR), distributed activation energy model (DAEM), model fitting, and isoconversional. The IPR and DAEM consider that the pyrolysis of heterogeneous materials, such as lignocellulosic biomass, occurs through several parallel and/or consecutive reactions. Consequently, each reaction is represented by an equation, increasing the mathematical complexity of system modeling. However, model fitting and isoconversional methods assume that thermal degradation occurs in a single-step reaction (global reaction), attenuating the mathematical complexity. Therefore, they are the most commonly used methods in the kinetic analysis of biomass.7-10 The model fitting methods require the assumption of f(α) and can lead to ambiguous results for the kinetic triplet since different f(α) fit the data equally well (from a statistical point of view), while the corresponding numerical values of E and A diverge to unacceptable values. In contrast, isoconversional methods do not require the assumption of f(α). They are also referred to as "model-free" methods. They use simple multi-heating and can estimate E varying with the degree of conversion, but they do not allow an analysis of A and f(α).1,2,11,12 The isoconversional methods can indirectly determine A and f(α), provided that the value of E obtained by these methods does not significantly vary with the extent of reaction. If this condition is met, A and f(α) can be determined using the kinetic compensation effect (KCE) or master plots.5 The KCE considers a linear relationship between the Arrhenius parameters, lnA and E, obtained under a single heating rate. Then, any variation in the experimental conditions that changes the value of E will also induce an additional compensatory response in the value of A. The most common cause for the KCE is the difference in the decomposition mode for a solid-state reaction. After establishing the appropriate mathematical relationships and determining the value of A, f(α) can be numerically reconstructed.5,13 The master plots compare the theoretical and experimental curves in which theoretical curves correspond to various ideal kinetic mechanism functions. Then, the theoretical and experimental master plots are a function of conversion, and the comparison between their curves allows us to select the most likely f(α) of the reaction process. After this procedure, the linearization of the conversion rate equation is used to determine A. Thus, we can obtain the kinetic triplet parameters.5,12 Mishra and Bhaskar14 studied the pyrolytic kinetics of rice straw using non-isothermal TG experiments. The authors considered various isoconversional methods to evaluate E. Based on the value of E, they estimated the values of A and f(α) using KCE and master plots. Lopes and Tannous12 applied isoconversional methods and IPR to investigate the thermal degradation kinetics of coconut fiber. Based on the values of E, f(α) was determined using master plots. Siddiqui et al.4 considered five different types of biomasses to determine the feasibility of alternative energy generation from waste. The authors selected coconut shells with the highest calorific value for a detailed kinetic analysis assuming a single-step reaction. They estimated the value of E using classic isoconversional, while the values of A and f(α) were obtained by the Kissinger equation and the master plots combined with the model fitting method, respectively. Mumbach et al.15 investigated the potential use of pecan nut shells based on their physicochemical properties and suitability for pyrolytic conversion into bioenergy products under kinetic and thermodynamic aspects. They determined the kinetic triplet parameters using isoconversional methods together with KCE. Tibola et al.16 studied the kinetic triplet parameters for the pyrolysis of sunflower seed husks (SSH). The authors determined the values of E using different isoconversional methods and considered a single-step reaction (global reaction). Due to the heterogeneity of lignocellulosic biomass, IPR was also used. The values of A and f(α), based on isoconversional data, were determined by the master plots. This work aims to determine a global equation for biomass pyrolysis, calculating the kinetic parameters A and f(α) based on thermogravimetric data for the pyrolysis of SSH using the KCE for A and numerical reconstruction for f(α). The theoretical conversion and conversion rate curves are constructed to evaluate the efficiency of the proposed mathematical representation. This work is the first study on the kinetic triplet for the pyrolysis of heterogeneous biomass (SSH) using the KCE and the construction of theoretical curves, comparing theoretical curves with those calculated from master plots methodology, which were previously published by this research group on Tibola et al.16 We followed the recommendations of the Kinetics Committee of the International Confederation for Thermal Analysis and Calorimetry (ICTAC).5
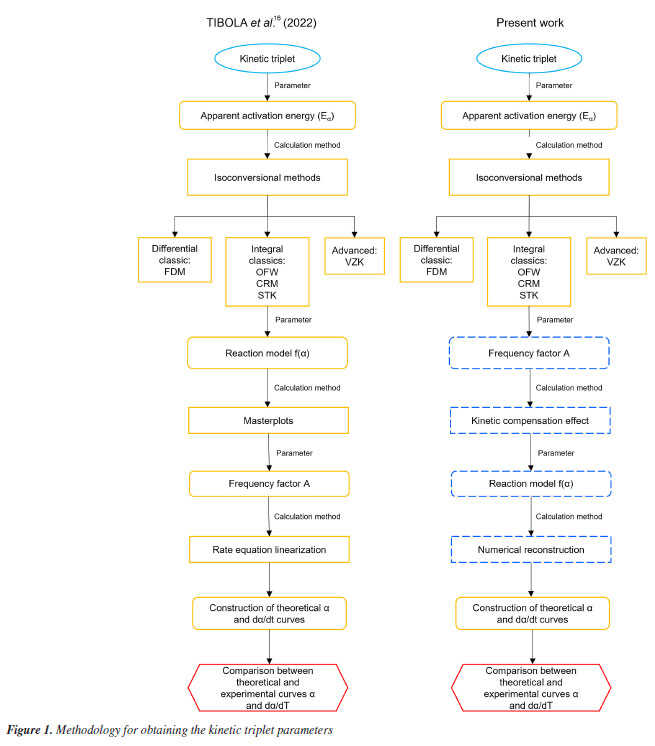
EXPERIMENTAL Biomass The sample of SSH was provided by Parecis S/A located in Campo Novo do Parecis, Mato Grosso State, Brazil, which produces vegetable oils and animal feed. In a previous work,16 this lignocellulosic material was processed to determine its chemical composition (extractive, lignin, and holocellulose content) and immediate analysis (moisture content, volatile materials, fixed carbon, and ash). Thermogravimetric analyses Thermogravimetric analyses were performed in previous work16 in which the samples were heated at 50 K min-1 from room temperature to 373 K. This temperature kept constant for 30 min for biomass drying. After drying, the material was heated to 1173 K at five different heating rates (5, 10, 15, 20, and 25 K min-1). The data on mass loss as a function of temperature increase was used to obtain the thermal degradation profile of SSH. The analyses were performed in duplicate to verify the effects of material heterogeneity. Baselines were constructed for each heating rate. The five different heating rates for thermogravimetric analysis followed the ICTAC recommendation,5 which provides at least three different heating programs. However, the thermal degradation curve (TG) for the heating rate of 25 K min-1 overlapped with the curve for the heating rate of 20 K min-1, which may have occurred mainly due to the interference of heat and mass transport. Thus, the heating rates of 5, 10, 15, and 20 K min-1 were selected for the kinetic triplet analyses. Determination of activation energy (E) Tibola et al.16 estimated the values of E for the thermal degradation of SSH at different heating rates by using isoconversional methods, such as the classic Friedman differential method (FDM), the three classic integral methods developed by OzawaFlynnWall (OFW), modified Coats-Redfern (MCR), and Starink (STK), and the advanced method developed by Vyazovkin et al.5 (VZK). These methods are detailed in Tibola et al.16 and Vyazovkin et al.5 The isoconversional methods consider the pyrolytic degradation of biomass as a homogeneous first-order reaction of solids, which generates volatile materials and charcoal as products. In addition, they do not require prior knowledge of the reaction mechanism to estimate the value of E.6,10 Tibola et al.16 also used the master plots to determine f(α) and the linearization of the rate equation to determine the global values of the Arrhenius pre-exponential factor (A0) and activation energy (E0). This work is an extension of research conducted by Tibola et al.,16 and aims to compare the kinetic analysis methodologies. Thus, we used the KCE to determine A0, and f(α) was selected after comparing theoretical and experimental curves. Figure 1 shows two schematic flowcharts presenting the differences in the methodologies for obtaining these kinetic triplet parameters.
Determination of frequency factor (A)
The value of A was determined by KCE, by applying the MCR integral method given in Equation 1. 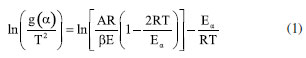 where g(α) is the integral reaction model, T is the absolute temperature (K), R is the universal gas constant (8.314 J K mol-1), β is the heating rate (K min-1) and Eα is the apparent activation energy (J mol-1). The MCR method was selected due to its extensive adoption in the non-isothermal analysis of biomass, which applies integral rate equations and asymptotic series expansion to approximate the temperature integral. In addition, it is also widely used to investigate the kinetics of dehydration and thermal degradation of other solid substances. The values of Eα and lnA were estimated by the slope and intercept coefficients, respectively, in the linear equation obtained from ln(g(α)/T2) as a function of 1/T.17,18 When applying linear regression to Equation 1 and fitting to experimental data, we obtained a set of values of Eα and lnA for 16 integral reaction models (g(α)) presented in Table 1, considering the reaction order up to the third order (N3). The value of α ranged from 0.05 to 0.95, with steps of 0.05. This procedure was repeated for heating rates of 5, 10, 15, and 20 K min-1. After establishing the sets of values of Eα and lnA, linear regressions were applied again according to Equation 2. 
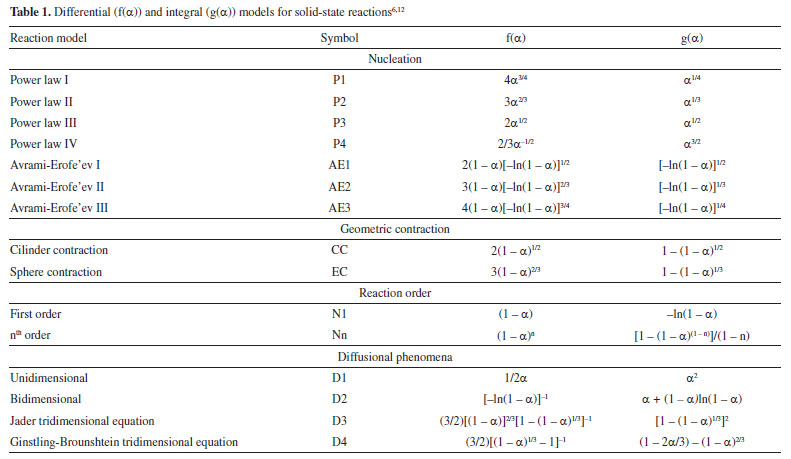
where i refers to each specific heating rate and a and b are the kinetic compensation constants and depend on the heating rate. Equation 2 provides the values of a and b by the slope and intercept coefficients, respectively, in the linear regression of the lnAi as a function of Eαi. After obtaining the compensation parameters a and b, the global value of A0 can finally be determined through Equation 2 by applying the global value of E0 previously calculated by the isoconversional methods.5,17,19,20 Determination of the reaction model (f(α)) The reaction model in its differential form (f(α)) was estimated from its numerical reconstruction using experimental data and, subsequently, compared to theoretical models. The numerical reconstruction of the experimental curve of f(α) was performed using Equation 3, as recommended by ICTAC.5 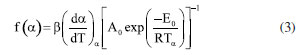 where A0 and E0 are those determined by KCE and isoconversional methods, respectively, and (dα/dT)α and Tα are obtained from the experimental data for each value of α. Then, each experimental heating rate (5, 10, 15, and 20 K min-1) generated an experimental curve of f(α) as a function of α. Subsequently, theoretical curves of f(α) as a function of α were constructed for each reaction model presented in Table 1 (16 models in total). We considered the reaction order up to order 3 (N3) since higher reaction order models presented high deviations compared to the others. The values of α ranged from 0.05 to 0.95. The experimental and theoretical curves of f(α) were compared through the least squares method (LS) given by Equation 4. Then, the average percentage deviation (APD) was determined using Equation 5. 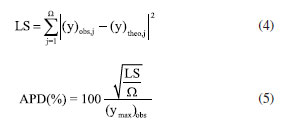 where Ω are the data points considered, (y)obs,j represents the experimental data, (y)theo,j indicates the values calculated by a set of parameters, and (ymax)obs is the maximum experimental value. Thus, the theoretical curve of f(α) presenting the smallest deviation from the reconstructed (experimental) model was selected as the best representation of this kinetic parameter for the pyrolysis of SSH. The equation for calculating APD was the same as that used by Tibola et al.16 Reconstruction of α and dα/dT curves The conversion (α) and conversion rate (dα/dT) curves as a function of temperature are reconstructed to analyze the fit quality between theoretical and experimental data for the pyrolysis of SSH. The fit quality indicates how suitable the theoretical parameters obtained from the kinetic triplet (Eα, A, and f(α)) are to predict the experimental behavior. The closer the theoretical prediction to the experimental behavior of the process, the greater the probability of efficient system optimization. Based on Tibola et al.,16 the experimental curves were constructed for α and dα/dT at heating rates of 5, 10, 15, and 20 K min-1. The theoretical curves for dα/dT and α were obtained using Equation 6 and its integrated form, respectively, by selecting the f(α) that best describes the pyrolysis and the other calculated kinetic parameters (A0 and E0). These curves were constructed for the same heating rates as the experimental curve. The numerical calculation was performed using Scilab software (version 6.0.1, Scilab Entrerprises, France, 2012) and the fourth-order Runge-Kutta method. 
RESULTS AND DISCUSSION We estimated the thermal degradation profile and the kinetic triplet parameters by analyzing the thermogravimetric data to better understand the pyrolysis of SSH. The characterization of the samples, the TG and its first derivative (DTG) data, and the values of E are detailed in Tibola et al.16 The higher the heating rate (up to 20 K min-1), the higher the temperature to achieve a certain mass fraction. Additionally, the authors observed two stages of thermal degradation of SSH, volatilization and carbonization. Volatilization occurred due to the reaction of volatile compounds originating from the decomposition of hemicelluloses, cellulose, and partially lignin. The remaining solid residual material at the end of the carbonization process corresponded to charcoal.16 Linear regressions of the isoconversional methods provided the values of E at each conversion level. We can observe that FDM and VZK methods showed a small difference compared to OFW, MCR, and STK, which reported similar results. Furthermore, considering OFW, MCR, and STK methods, OFW presented the lowest deviation in conversion, with an average value of 131.47 kJ mol-1.16 Frequency factor (A) Applying Equation 1 (MCR method) for each reaction model g(α), considering the selected values of α, and for each heating rate (5, 10, 15, and 20 K min-1), we obtained a total of 64 pairs of Eα and lnA for the liner regression. Figure 2 shows lnA as a function of E for the pyrolysis of SSH.
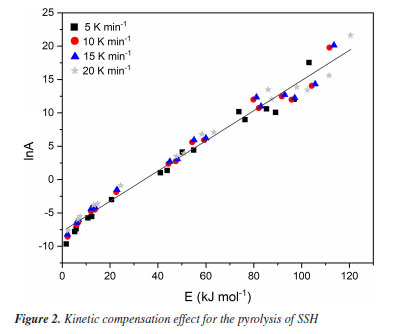
A linear trendline in the scatter plot, with a coefficient of determination (R2) of 0.982, indicates a satisfactory data fit. From the slope and intercept coefficients in the linear equation, the kinetic compensation constants a and b in Equation 2 were 0.2263 and -7.767, respectively. Applying Equation 2 for these kinetic compensation constant values and considering E0 from the OFW method (which showed the lowest deviation among the isoconversional methods), we obtained the value of A0 as 3.517 × 10⁹ s-1. Reaction model f(α) After determining the average values of E0 and A0, we can estimate f(α) that best represents the pyrolysis of SSH by comparing the theoretical and experimental curves of f(α) as a function of α. Figure 3 shows the theoretical curves for different f(α) together with the experimental curves at heating rates of 5, 10, 15, and 20 K min-1. Table 2 presents the values of APD at each heating rate to compare theoretical and experimental curves of f(α).
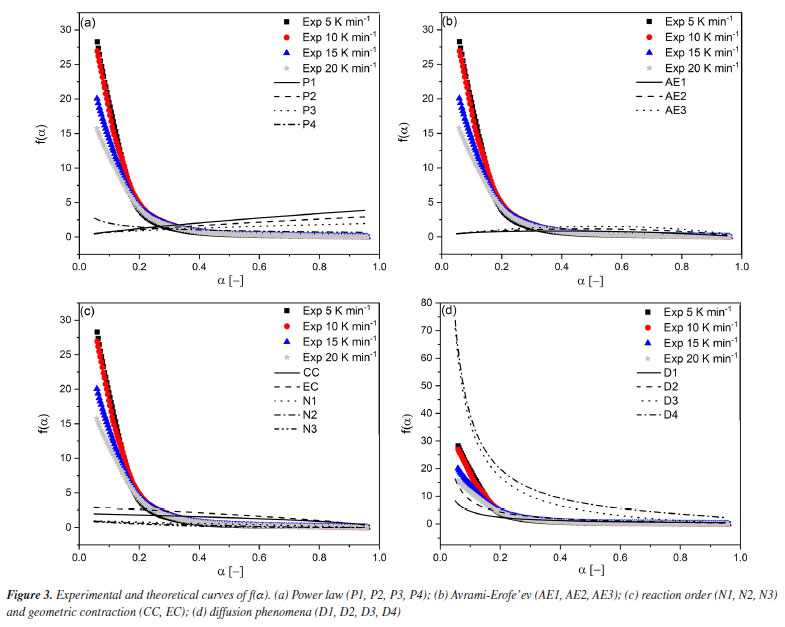
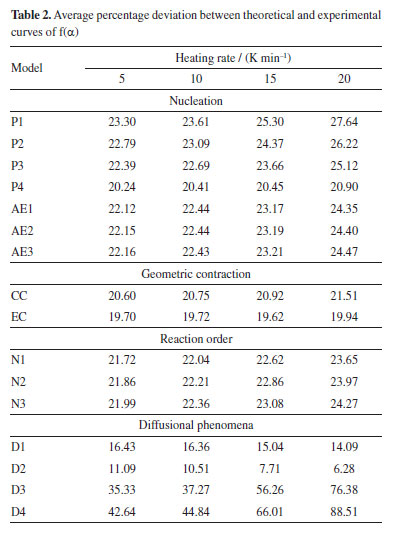
From Table 2, we can observe that the D2 reaction model presented the lowest deviation compared to the experimental values for all heating rates. Consequently, it corresponds to the reaction model that best describes the pyrolysis of SSH. Theoretical and experimental curves of α and dα/dT After determining the kinetic triplet parameters, the theoretical conversion (α) and conversion rate as a function of time (dα/dt) can be reconstructed and compared to the experimental curves, considering the relation dα/dt = β dα/dt. This allowed us to assess how effectively the obtained kinetic data can predict the experimental behavior of the pyrolysis of SSH. Figure 4 shows the experimental and theoretical curves at heating rates of 5, 10, 15, and 20 K min-1.
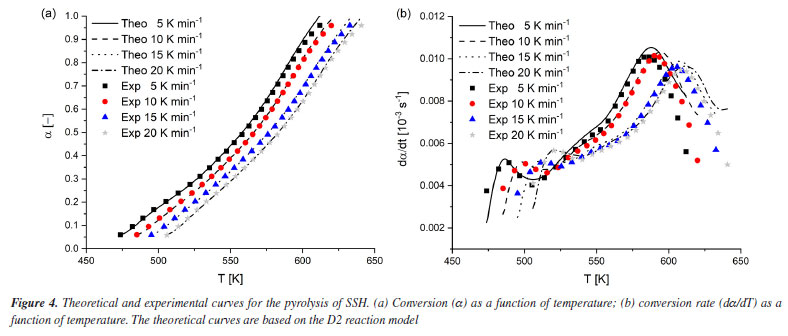
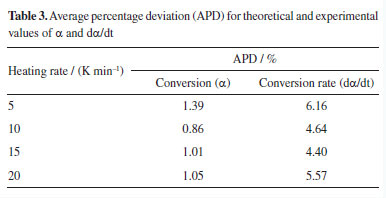
The data in dα/dt curves showed higher deviations compared to α curves. This can be explained by the shape of the dα/dt curve, which originates from differential data. Consequently, as previously discussed, these curves are more sensitive in representing single-step decomposition reactions. However, the theoretical curves as a function of temperature showed good agreement with the experimental results. Table 3 shows the values of APD for the theoretical and experimental curves at each heating rate calculated by Equations 4 and 5.
Siddiqui et al.4 investigated the feasibility of energy generation from biomass waste and reported that the average values of E and A were 109.90 kJ mol-1 and 4.37 × 10⁹ s-1, respectively. The reaction model was f(α) = (1 - α)4.6654 [-ln(1 - α)]-0.2, indicating a nucleation-based order mechanism for coconut shells. Lopes and Tannous12 evaluated the thermal degradation of coconut fiber using isoconversional methods, and the average values of Eα were 179.4, 174.4, 173.7, 173.9, and 169.2 kJ mol-1 for FDM, OFW, MCR, STK, and VZK, respectively. The reaction model that best described the process was the three-dimensional diffusion model by Jader (D3), considering the average value of Eα from the VZK method. After selecting f(α), the linearization of the rate equation provided a value of A equal to 1.5 × 10⁸ s-1. Comparing the experimental and theoretical curves at heating rates of 5, 10, and 15 ºC min-1, the APD were 3.2, 2.7, and 3.5% for α and 12.5, 13.3, and 13.2% for dα/dT, respectively. The authors concluded that these results satisfactorily described the overall reaction kinetics of biomass. Tibola et al.16 also reconstructed theoretical and experimental curves of α and dα/dt as a function of temperature for the pyrolysis of SSH, considering theoretical single-step reaction models. However, their values of APD between theoretical and experimental curves were higher than in this work. For heating rates of 5, 10, 15, and 20 K min-1, the values of APD were 6.70, 1.86, 1.74, and 2.21% for α and 17.87, 9.24, 9.83, and 8.57% for dα/dt, respectively. These values were on average 290 and 219% higher than those achieved in this work for α and dα/dt, respectively. This may indicate that the methods selected in the present work to estimate the values of A (KCE) and f(α) (numerical reconstruction) in the kinetic triplet led to greater accuracy in predicting the pyrolytic behavior of SSH. Despite considering single-step reaction models, the kinetic model representation for the pyrolysis of SSH obtained in this work is satisfactory since it showed low deviations. This suggests that the kinetic triplet parameters estimated through isoconversional methods combined with KCE are suitable for representing the reactive behavior of heterogeneous materials, even though the theoretical model was originally developed for homogeneous materials. This technique is recommended by the ICTAC and allows a unified equation for heterogeneous materials, which makes numerical and computational simulation of the pyrolysis process easier than multiple reaction models, such as parallel and independent reaction models.
CONCLUSIONS This kinetic study estimated the frequency factor (A) and the reaction model (f(α)) parameters based on the kinetic compensation effect (KCE), considering the activation energy (Eα) data from a previous study.16 Additionally, theoretical and experimental curves were reconstructed to assess the fit quality of the estimated parameters. We considered the average value of Eα of 131.47 kJ mol-1 obtained through the isoconversional method OFW and determined the average value of A as 3.517 × 10⁹ s-1. Based on these values, f(α) was numerically reconstructed, and a diffusion-based mechanism (D2) best represented the pyrolysis process. The theoretical curves for α and dα/dT aligned well with the experimental data, showing mean percentage errors of 1.08 and 5.19%, respectively. These results indicate that the KCE effectively described the pyrolysis kinetics of SSH, as recommended by ICTAC.
DATA AVAILABILITY STATEMENT All data are available within the text.
ACKNOWLEDGMENTS The authors gratefully acknowledge the financial support of FAPEMIG (Fundação de Amparo à Pesquisa do Estado de Minas Gerais, grant number APQ-00652-18).
AUTHOR CONTRIBUTIONS Arthur T. F. A. Araújo: investigation, data curation, writing original draft; Nádia G. Sousa: data curation, visualization, writing original draft, writing review and editing; Daniel Alves Cerqueira: conceptualization, methodology, writing original draft, writing review and editing; Cássia R. Cardoso: conceptualization, data curation, resources, supervision, visualization, writing review and editing.
REFERENCES 1. Luo, L.; Zhang, Z.; Li, C.; Nishu; He, F.; Zhang, X.; Cai, J.; Energy 2021, 233, 121194. [Crossref] 2. Açıkalın, K.; Bioresour. Technol. 2021, 337, 125438. [Crossref] 3. Rueda-Ordóñez, Y. J.; Arias-Hernández, C. J.; Manrique-Pinto, J. F.; Gauthier-Maradei, P.; Bizzo, W. A.; Bioresour. Technol. 2019, 292, 121923. [Crossref] 4. Siddiqi, H.; Bal, M.; Kumari, U.; Meikap, B. C.; Renewable Energy 2020, 148, 756. [Crossref] 5. Vyazovkin, S.; Burnham, A. K.; Criado, J. M.; Pérez-Maqueda, L. A.; Popescu, C.; Sbirrazzuoli, N.; Thermochim. Acta 2011, 520, 1. [Crossref] 6. White, J. E.; Catallo, W. J.; Legendre, B. L.; J. Anal. Appl. Pyrolysis 2011, 91, 1. [Crossref] 7. Casoni, A. I.; Gutierrez, V. S.; Volpe, M. A.; J. Environ. Chem. Eng. 2019, 7, 102893. [Crossref] 8. Hu, S.; Jess, A.; Xu, M.; Fuel 2007, 86, 2778. [Crossref] 9. Ren, X.; Chen, J.; Li, G.; Wang, Y.; Lang, X.; Fan, S.; Bioresour. Technol. 2018, 261, 403. [Crossref] 10. Simão, B. L.; Santana Júnior, J. A.; Chagas, B. M. E.; Cardoso, C. R.; Ataíde, C. H.; Algal Res. 2018, 32, 221. [Crossref] 11. Janković, B.; Chem. Eng. J. 2008, 139, 128. [Crossref] 12. Lopes, F. C. R.; Tannous, K.; Thermochim. Acta 2020, 691, 178714. [Crossref] 13. Xu, D.; Chai, M.; Dong, Z.; Rahman, M. M.; Yu, X.; Cai, J.; Bioresour. Technol. 2018, 265, 139. [Crossref] 14. Mishra, G.; Bhaskar, T.; Bioresour. Technol. 2014, 169, 614. [Crossref] 15. Mumbach, G. D.; Alves, J. L. F.; da Silva, J. C. G.; Di Domenico, M.; Arias, S.; Pacheco, J. G. A.; Marangoni, C.; Machado, R. A. F.; Bolzan, A.; Renewable Sustainable Energy Rev. 2022, 153, 111753. [Crossref] 16. Tibola, F. L.; de Oliveira, T. J. P.; Ataíde, C. H.; Cerqueira, D. A.; Sousa, N. G.; Cardoso, C. R.; Biomass Convers. Biorefin. 2022, 13, 13841. [Crossref] 17. Doddapaneni, T. R. K. C.; Konttinen, J.; Hukka, T. I.; Moilanen, A.; Ind. Crops Prod. 2016, 92, 244. [Crossref] 18. Manikandan, G.; Rajarajan, G.; Jayabharathi, J.; Thanikachalam, V.; Arabian J. Chem. 2016, 9, S570. [Crossref] 19. Vuppaladadiyam, A. K.; Antunes, E.; Sanchez, P. B.; Duan, H.; Zhao, M.; Renewable Energy 2021, 167, 42. [Crossref] 20. Zhang, Z.; Duan, H.; Zhang, Y.; Guo, X.; Yu, X.; Zhang, X.; Rahman, M. M.; Cai, J.; Energy 2020, 207, 118290. [Crossref]
Associate Editor handled this article: Boniek G. Vaz |

On-line version ISSN 1678-7064 Printed version ISSN 0100-4042
Química Nova
Publicações da Sociedade Brasileira de Química
Caixa Postal: 26037
05513-970 São Paulo - SP
Tel/Fax: +55.11.3032.2299/+55.11.3814.3602
Free access