
 |
 |
 |
 |
 |
Artigo
| Tannic acid supported by magnetite nanoparticles for the removal of CdII and PbII from water |
|
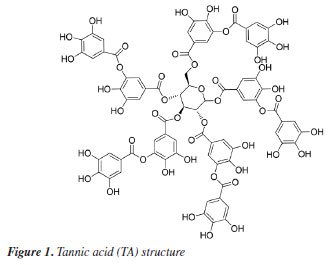
Camilo Eduardo García Henao Grupo de Investigación en Materiales Activos (G+), Departamento de Química, Universidad del Tolima, 730006299 Ibagué, Tolima, Colombia Received: 11/18/2024 *e-mail: aguarnizof@ut.edu.co In recent decades, increasing concerns about heavy metal contamination in wastewater and the high costs associated with conventional removal methods have driven the search for greener and more cost-effective adsorbents. In this study, we focused on a hybrid composed of tannic acid (TA) and magnetite nanoparticles (Fe3O4@TA) as an alternative for removing CdII and PbII from aqueous solutions. Characterization techniques, including transmission electron microscopy (TEM), scanning electron microscopy (SEM), thermogravimetric analysis (TGA), matrix assisted laser desorption ionization-time of flight mass spectrometry (MALDITOF-MS), and Fourier transform infrared spectroscopy (FTIR), were employed to confirm the nanometric nature of the composite and its organic-inorganic composition. Several adsorption parameters, such as pH, contact time, adsorption kinetics, and initial ion concentration, were evaluated. Sorption kinetic data were best described by the pseudo-second order kinetic model, providing equilibrium rate constants (k2) of 0.0194 g mg-1 min-1 for CdII and 0.0134 mg-1 min-1 for PbII. Furthermore, the adsorption isotherms for the Fe3O4@TA adsorbent exhibited a better fit to the Freundlich isotherm model compared to the Langmuir isotherm model. This nanocomposite holds promise as a sustainable and economical solution for heavy metal removal from wastewater. INTRODUCTION The increasing concentration of pollutants in water and soil, originating from human activities, is a significant concern in the present. Unlike some organic contaminants, heavy metals are not biodegradable and tend to accumulate in living organisms, causing harmful effects. Toxic heavy metals are of particular concern in industrial waters, surface, and groundwater, stemming from mining operations, tanneries, electronics manufacturing, electroplating, textile mills, and even in drinking water sources. To deal with contaminated aquifers, numerous remediation technologies have been employed worldwide. Notable methods include filtration, centrifugation, precipitation, coagulation, oxidation, solvent extraction, ion exchange, and adsorption, among others.1 Adsorption, due to its simplicity, operability, and versatility, is a preferred technology in the field of environmental protection. It involves certain solids that can concentrate specific substances, such as heavy metals, onto their surfaces.2 In recent decades, several adsorption techniques involving magnetite nanoparticles (Fe3O4 or MNPs) have gained attention as a sustainable option for greener chemical processes.3 The combination of nanoscale size and magnetic properties in MNPs offers an exceptionally large surface area to volume ratio, crucial for adsorbing a maximum quantity of pollutants.4 Additionally, the ease of recovering adsorbents through external magnetic fields enhances the potential for practical use. Despite extensive exploration of carbon-based and silica adsorbents,5-7 significant advancements are still required, particularly in the pursuit of truly sustainable protocols.8 In our ongoing study aimed at developing greener and more sustainable processes for nanoadsorbent synthesis, we conceived the idea of utilizing: (i) MNPsupported biomolecules, (ii) an entirely benign aqueous protocol eliminating the need for toxic organic solvents, (iii) ultrasound technology for environmentally friendly synthesis, and (iv) tannic acid (TA, Figure 1) as a metal bioadsorbent. The initial step in this concept was the selection of a renewable biomolecule for surface modification of MNPs, like TA, which are high-molecular weight polyphenolic compounds, widely available, safe, and inexpensive, caught our attention. These compounds are characterized by a high content of hydroxyl groups in their structure and are well-known for their strong interaction with iron and heavy metals.9,10
MNPs are derived from cost-effective materials through a straightforward synthesis process conducted in water, and their properties can be easily tailored through structural surface modifications in a post-precipitation approach.11 These attributes contribute to cost reduction and enhanced availability for large-scale applications. Our research focuses on a green route to increased availability for large-scale applications. While existing literature explores the use of MNPs and TA as adsorbents for metals in aqueous effluents, it is imperative to highlight the distinctive synthetic process developed in this study. Specifically, prior studies12-14 have employed direct MNP synthesis with core growth in the presence of a coating agent through coprecipitation methods. In contrast, our investigation uses a post-precipitation synthesis approach assisted by ultrasound. Each type of material discussed in the literature presents unique properties regarding adsorption behavior and involves different preparative methodologies. Therefore, it becomes essential to characterize the obtained material, even when the precursors are identical. In the materials science, seemingly minor variations in synthetic pathways can result in entirely distinct materials. Our study aims to contribute nuanced insights by adopting a modified synthesis strategy, enhancing the understanding of MNPs and TA as potential adsorbents in wastewater treatment. Additionally, stable precursors for the magnetite core were utilized, as sulfate salts are less corrosive compared to chlorides often used in related literature. In the context of this study, significant contributions are made in terms of the chosen adsorbent CdII and PbII in water, the ultrasound-based synthesis method for surface modification, the structure of the surface and the focus on experimental variables related to adsorption. In this regard, the adsorbent material synthetized was applied to laboratory-simulated solutions.
EXPERIMENTAL Chemicals Iron(II) sulfate 7-hydrate, ammonia 30% and iron(III) sulfate x-hydrate were purchased from PanReac, tannic acid (TA), potassium bromide (FTIR grade), cadmium chloride and lead chloride were procured from Merck-Sigma-Aldrich, ethanol and acetone were purchased from Honeywell. Distillated and then deionized water was deoxygenated by bubbling nitrogen for 30 min prior to the immediate use. The Nd-Fe-B magnet was obtained in a local market to separate magnetic particles. Synthesis of magnetite nanoparticles Magnetite nanoparticles (Fe3O4 NPs or MNPs) were prepared using the standard wet chemical method.15 Typically, FeSO4.7H2O (6.95 g, 25.25 mmol) and Fe2(SO4)3.xH2O (10.0 g, 25.78 mmol) were dissolved in deoxygenated water (250 mL) in a Schlenk flask under nitrogen purge, and heated to 50 ºC. Then, 25% ammonia solution (30 mL) was injected with a syringe into the reaction mixture within 10 s under vigorous mechanical stirring (500 rpm) for 1 h. The resultant suspension was collected by an external magnet (filtration is unnecessary), redispersed, and washed with deionized water until neutral pH was reached. The magnetite NPs obtained were dry under vacuum at 60 ºC. Preparation of TA-coated Fe3O4 nanoparticles (Fe3O4@TA) Fe3O4 NPs (700 mg) were dispersed in an ultrasound bath (40 kHz, Rovsun 230HT) by 15 min in deionized water (50 mL), then a solution of tannic acid (500 ppm, 50 mL) was added. After sonication for 2 h the suspended NPs were separated from the aqueous solution by magnetic decantation, washed with deionized water several times and dried in vacuum at 50 ºC for 2 h. To prevent overheating, the ultrasound bath was maintained at 22 ºC using a JSRC-06C refrigerated circulation bath device. The immobilization of TA on Fe3O4 NPs was monitored by measuring the remaining TA in solution on a Thermo Genesys 10S ultraviolet-visible (UV-Vis) spectrophotometer. For that purpose, an aliquot was taken from reaction mixture, the dispersed nanoparticles were separated using an external magnet, then the TA remaining in dissolution were estimated by the referenced UV-Vis spectrometric method (Folin-Ciocalteu).3,16,17 Briefly, a linear plot was performed from 1.00 to 20.00 mg L-1 from a stock solution (1000 mg L-1) of tannic acid. The samples were mixed with 0.5 mL of Folin-Ciocalteu solution, 1.00 mL of a 20% m/v Na2CO3 solution, then water was added to complete 10.00 mL. The obtained samples were incubated in dark for 2 h before the read of their absorbances at 725 nm. The total phenolic content was expressed as tannic acid equivalent (TAE) in mg L-1. Characterization Fourier transform infrared (FTIR) spectra were obtanied on a Nicolet Impact 400 FTIR spectrometer. In an agatha mortar were placed 1 mg of the sample and 100 mg of spectral pure reagent potassium bromide (KBr). Under infrared light, samples of KBr were fully mixed and ground to make a fine powder. The ground mixture was evenly put into the mold, and then, the mold was put into the pressure gauge (about 10 T cm-2 for 2 min), a uniform translucent ingot was achieved. The morphology of the NPs was analyzed using scanning electron microscopy (SEM) and a transmission electron microscopy (TEM) in a Leica-Zeiss LEO 440 and JEOL 2100 microscope, respectively, with a thermionic gun LaB6 200 kV equipped with Gatan Orius high resolution CCD camera. The samples dispersed in ethanol were deposited over a Formvar/carbon film on 200 mesh copper grids and the solvent (ethanol) was removed by evaporation at room temperature. Size measurement of TEM was compared with those from dynamic light scattering (DLS) using a Zetasizer Nano ZS 30 (Malvern). The analyses were carried out using a He-Ne laser (633 nm) at fixed scattering angle of 173º. Automatic optimization of beam focusing, and attenuation was applied for each sample. Measurements were performed at 25 ºC, Fe3O4@TA suspensions in water were introduced into 3 mL disposable cuvettes (10 mm optical path length). The mass spectra (MS) were collected with a matrix assisted laser desorption ionization-time of flight mass spectrometry (MALDITOFMS) ABSciex-2010 in negative ion counts in α-cyano-4hydroxycinnamic acid (CHCA) to elucidate the structure of the adsorbed species in Fe3O4@TA. A vial was used to disperse 1.0 mg of Fe3O4@TA in 5 mL of deionized water. A 20 μL aliquot of the nanoparticle suspension was then mixed with 20 μL of a saturated solution of CHCA as the MALDI matrix. Subsequently, 1 μL of the resulting mixture was carefully spotted onto a MALDI plate and allowed to air-dry at room temperature before analysis. The thermogravimetric analysis (TGA) was performed in a TGA/SDTA851e/LF/1600 to evidence thermal decomposition of the organic fraction in nanocomposites. The curves were collected from 30-100 ºC at a heating rate of 10 ºC min-1 under nitrogen flow. Metal adsorption assays The selected method for sorption assays was based on data from the literature.2 The adsorption of heavy metal ions on the Fe3O4@TA nanohybrid were performed in batch. Typically, 10.0-30.0 mg of nanocomposite was in contact with 20.0 mL of metal solution; after vigorous stir at 25 ºC, the suspension was separated with an external magnet to retain the solids and additional centrifugation for total retention of solids. Then, the liquid fractions were withdrawn to measure the concentration of unabsorbed metal ion by atomic absorption spectroscopy using an Analitik Jena spectrometer model ZEEnit 700P. Five standard solutions for each metal ion (110 mg L-1) were prepared in 100 mL flasks. The concentration of samples was determined by linear regression. The pH measurements were performed by using a MettlerToledo 031215 pH meter combined with a glass electrode (standardized by pH: 4.00 and 8.00 buffers). Containers were shaken during the adsorption experiments in an orbital shaker Being set to 250 rpm. A Unico Power Spin FX model centrifuge at a rate of 3000 rpm for 10 min was used to separate solid parts from the solutions after complete adsorption. The metal absorption capability qe (mg g-1) was calculated as follows: 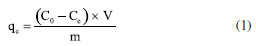 were C0 and Ce (mg) are the initial amount of metal ion and the amount of metal ion unadsorbed in the solution at the equilibrium time, respectively. V (L) is the volume of the CdII ion solution and m is the mass of nanocomposite (g). The percentage of metal removal refers by equation: 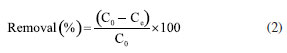 Kinetics The effect of contact time was evaluated using the selected initial concentration according to the CdII maximum adsorption capability. Thus, 30.0 mg of nanohybrid was dispersed in 20.0 mL of a solution of CdII 30.0 ppm and aliquots were taken each certain time. Experimental data was fitted with the pseudo-first model and pseudo-second order rate model to establish the adsorption kinetic. 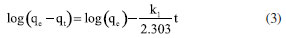 where, qt and qe are the amount of solute sorbed per mass of sorbent (mg g-1) at any time and equilibrium, respectively, and k1 is the rate constant of first-order sorption (min-1). The straight-line plot of log (qe-qt) against t gives log(qe) as slope and intercept equal to . Hence the amount of solute sorbed per gram of sorbent at equilibrium (qe) and the first-order sorption rate constant (k1) can be evaluated from the slope and the intercept. Pseudo-second order kinetic model is represented by:  where, k2 is the rate constant calculated from the intercept, qt is the metal uptake capacity at any time t. Langmuir and Freundlich isotherms The effect of the initial concentration of the metal ion on the uptake by Fe3O4@TA was carried out by dispersing 30.0 mg of adsorbent for PbII and 10.0 mg for CdII in a series of flasks containing 20.0 mL of CdII solution with concentrations in the range of 30.0200.0 mg L-1 at pH 6.0. The suspensions were stirred in a shaker at 25 ºC for 6 h. The adsorbent was removed under magnetic field. After that, the liquid fractions were withdrawn to measure the concentration of unabsorbed metal ion. Then, the adsorption capability of CdII was determined as function of qe. The Langmuir and Freundlich isotherm models were used to explain the sorption process. The linear equation of the Langmuir isotherm is presented as:  were KL is the Langmuir constant or sorption coefficient (L mg-1) and qm is the maximum amount of metal ions required to form a monolayer (mg g-1). The Freundlich isotherm model is described by the following linear form:  were qe is the metal uptake (mg g-1) at the equilibrium, KF is the measure of the sorption capacity (L mg-1), n is the sorption intensity, and Ce is the concentration in the equilibrium or final concentration (mg L-1).
RESULTS AND DISCUSSION Synthesis of Fe3O4@TA Figure 2 outlines the synthetic route utilized for the creation of Fe3O4@TA. Initially, the process involved the synthesis of MNPs, followed by the subsequent grafting of tannic acid (TA) onto the Fe3O4 surface. The grafting procedure of TA was facilitated through sonication. Upon dispersing magnetite nanoparticles (MNPs) in the TA solution and subjecting them to a sonochemical process, it was noted that the TA concentration decreased to 105.3 mg L-1. This reduction in TA concentration implied that a portion of the phenolic compound was retained by the MNPs. This observation was further supported by the unchanged TA concentration in the control test where MNPs were absent.
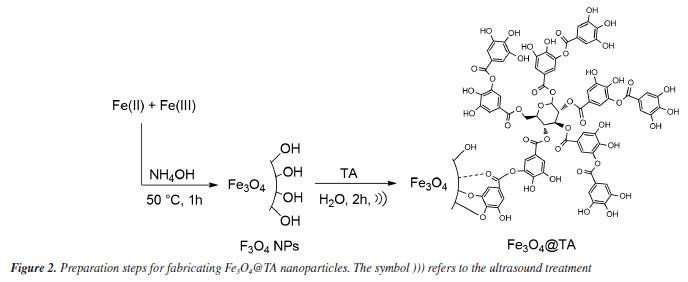
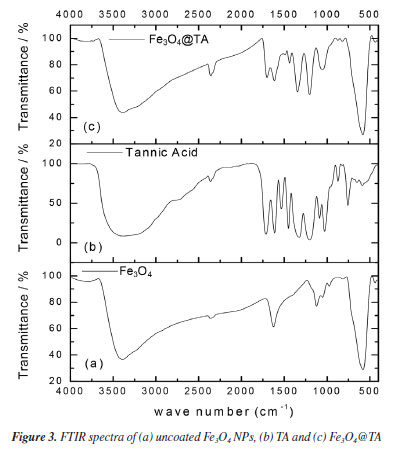
Based on these outcomes, it was deduced that the MNPs effectively engaged with TA, resulting in a decrease in their concentration in the liquid portion. Subsequently, the material obtained after ultrasonic treatment was purified, isolated, and dried to yield a black solid termed Fe3O4@TA, and external magnetic responsive. This solid was then reserved for subsequent studies. FTIR analysis The presence of TA in the nanohybrid was detected using FTIR. Figure 3 shows patterns of naked Fe3O4, AT and Fe3O4@TA. In accordance with theoretical calculations, the bond between TA and magnetite NPs is mediate mainly by -OH and carbonyl groups.18 In the FTIR spectrum, the low wave numbers (700-500 cm-1) come from stretching vibrations of the Fe-O of bulk magnetite (Figure 3a). The absorption band at 1636 cm-1 is due to absorbed water.13 Furthermore, the strong absorption band at around 3400 cm-1 is characteristic of O-H vibrational stretching. In pure TA (Figure 3b) the characteristic strong wide band of O-H stretching is observed. The FTIR also includes the band of C-O stretching at 1028 cm-1, the bands at 1200 and 1320 cm-1 due to stretching of C=C from aromatic system. The conjugated carbonyl group presents a strong signal at 1710 cm-1. Additionally, same bands at 1200 and 1320 cm-1 from C=C vibration, and those bands at 1610 and 1710 cm-1 due to C=O vibrational stretching for pure TA and the Fe3O4@TA.
Thermogravimetric analysis As illustrated in Figure 4, the thermal behavior of Fe3O4@TA was analyzed using thermogravimetric analysis (TGA) and its first derivative (DTGA) (Figures 4a and 4b) revealing the presence of volatile organic constituents. The thermogram of MNPs (Figure 4a) displayed a mass loss of 4.00% occurring between 200 and 600 ºC. Initially, a weight loss of approximately 2.80% within the temperature range of 65 to 140 ºC was observed, attributed mainly to the desorption of water from the surface of the material. Subsequently, a broad weight loss of 9.95% was recorded within the 170-560 ºC temperature interval, indicating the decomposition of immobilized TA. More specifically, the temperature ranges of 170-270 ºC and 400-560 ºC were associated with the dehydroxylation process, as previously reported by Wu et al.19
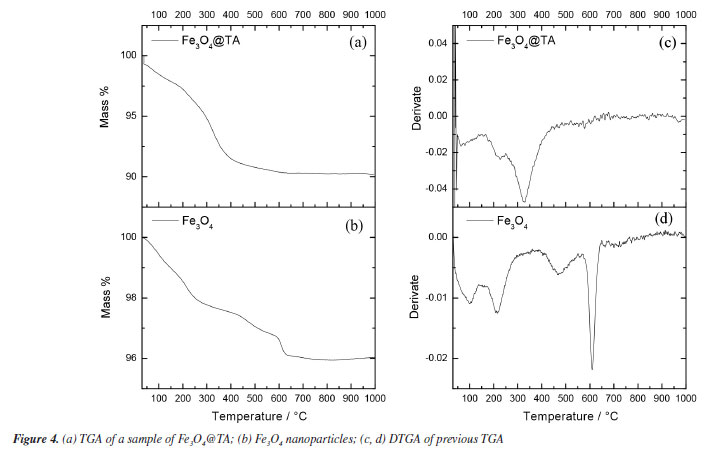
The thermograms in Figures 4a and 4b demonstrated evidence of the reduction of Fe3O4 to Fe and FeO within the temperature range from 570-650 ºC, with the peak occurring at 613 ºC, consistent with findings by Rudolph et al.20 Interestingly, the absence of this peak in the Fe3O4@TA thermogram implied that the decomposition products of TA might have a protective effect on the MNPs inorganic core. No further decomposition was observed at higher temperatures since the thermogram in Figure 4 indicated that no additional weight loss occurred beyond 650 ºC, indicating the complete decomposition of TA and resulting in an inorganic non-volatile content of 90.12%. In contrast, the Folin-Ciocalteau analysis indicates that the total polyphenolic content absorbed by the MNPs is approximately 19.73 mg. If we consider additive masses, the total would be 719.74 mg of Fe3O4@TA, which is equivalent to an organic content of about 2.70% m/m. However, the TGA reveals a value of 9.88%, which does not represent the organic content but rather the volatile fraction. This disparity may be attributed to factors associated with structural alterations on the surface of the bare MNPs by TA as mentioned before. The bare MNPs contain adsorbed water molecules on their surface, even after vacuum drying. Since the quantity of these molecules and the molar mass of the MNPs are unknown, it is not possible to establish a direct relationship between the chemical groups that can be substituted by polyphenols. It remains unclear whether polyphenols only replace water molecules or affect the ligand environment of iron(II) and iron(III) in the crystal structure. Therefore, correlating the results of the Folin-Ciocalteau assay with TGA is not straightforward. Furthermore, as mentioned previously, there is no well-defined temperature range that exclusively indicates TA decomposition. Given these uncertainties, we prefer to denote the final TGA residue as inorganic non-volatile content rather than the organic content in the form of TA, and Folin-Ciocalteau as a test to check the loss of TA in the reacting mixture. Electron microscopy images and dynamic light scattering analysis Scanning electron microscopy (SEM) is a tool for determining surface morphology of the nanocomposite. SEM images of Fe3O4@TA (Figure 5a) shows that no grain boundaries, terraces, or steps were observed, indicating that there was no significant growth of crystal domains at the expense of smaller nanoparticles through processes like Ostwald ripening or coalescence during the sonochemical process.21,22
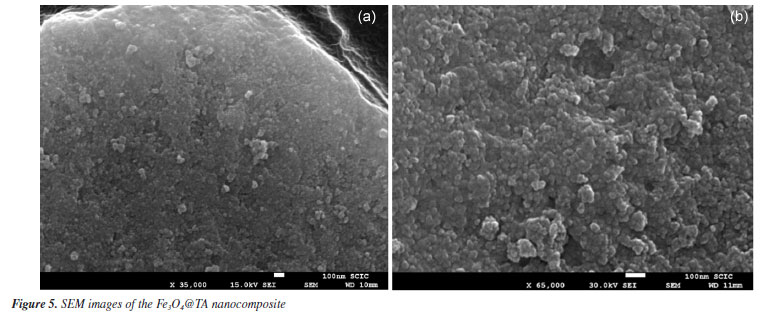
The nanohybrid appears to be formed by cauliflower-like particles setting an irregular and porous surface (Figure 5b). Moreover, the transmission electron microscopy (TEM) images (Figure 6) confirm that the nanoparticles exhibit a morphology characterized by a collection of spherical particles of nanometric size. The nanoparticles are observed as densely packed aggregates, which can be attributed to the presence of attractive forces among magnetite NPs. This aggregation is influenced by the presence of the TA layer (Figures 6a and 6b). The occurrence of van der Waals forces due to the organic capping on the nanoparticle surfaces contributes to the clustering into aggregated regions.
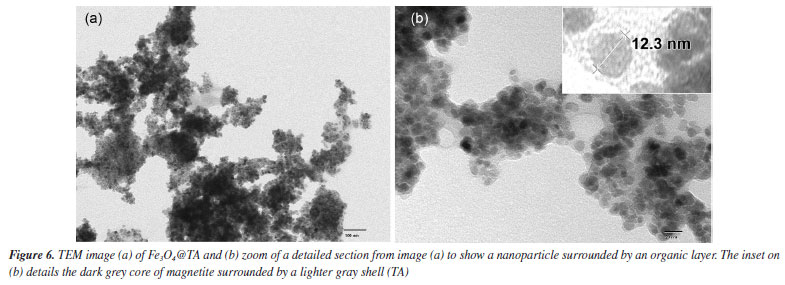
Despite the prevalent clustering, a thorough analysis of the TEM images enabled the determination of the size distribution of the nanoparticles, revealing an average diameter of 13.3 ± 2.1 nm (Figure 7a). This observation supports the notion that the magnetic core of the TA-modified magnetite nanoparticles consists of a single magnetite crystallite (depicted by dark gray spots in Figure 6b), encased by a lighter gray shell, as illustrated in the inset of Figure 6b.
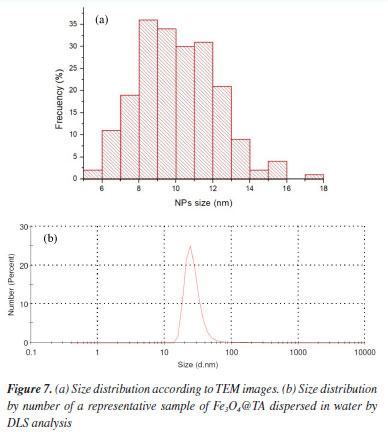
When a sample of Fe3O4@TA in water as dispersant was analyzed in a dynamic laser scattering device (DLS), a unimodal size distribution by number was obtained, as can be seen in Figure 7b. It shows particle diameter distribution at ca. 5 and 50 nm, and particles with a diameter 25.7 ± 13.3 nm are predominant. As such, the diameter determined by DLS analysis based on the diffusional properties of the particles is indicative of the apparent size of the hydrated/solvated dynamic particle,23,24 and it was to be expected that there would be a difference between the diameter thus determined with TEM and DLS analysis. The radius of the curvature effect is the main factor contributing to the large difference observed in DLS and TEM.25 At the size of around 25.7 nm the average hydrodynamic diameter is around 12.4 nm larger than the TEM size. Moreover, the standard deviation of DLS measurement of these particles also increased significantly to ± 13.3 nm compared to ± 2.1 nm found in TEM analysis (Figure 7a). MALDI-TOF-MS analysis Mass spectrometry (MS) is an interesting technique that allows detecting biomolecules without sample pre-treatment. Matrix-assisted laser desorption (MALDI) is a soft ionization method adapted for ionizing non-volatile analytes, such as biopolymers, and enables the production of intact molecule ions to be analyzed in a time-of-flight (TOF) mass spectrometer.26 With those insights, the nanocomposite Fe3O4@TA was analyzed by MALDI-TOF-MS to determine the presence of TA molecules. It was conceptualized that a molecule of TA is composed by a central glucosyl unit (Glc) condensed with five gallic acid (GA) dimers and, thereby, TA corresponds to the formula GlcGA10 (glucose-decagalloyl acid). Taking that into account, in the mass spectra of the MALDI-TOF (Figure 8) the molecular ion of m/z 1701.2 that corresponds to the molar mass of GlcGA10 was not detected, as expected. Instead, a peak at m/z 1752.2 for heavier chemical specie was noticed. This issue prompted us to come up with the inclusion of an iron atom as the parent ion at m/z 1752.2, which possibility the existence of an organometallic complex ion released when decomposition of Fe3O4@TA is induced in MALDI. We also considered both the multiple deprotonations of phenolic hydroxyls to produce a negative tannate (glucose-gallates) and its stabilization by FeIII coordination. In theory, tannins show a better ability for deprotonation than for protonation. This observation can be related to the fact that hydroxyl functional groups present in a tannin molecule are phenolic hydroxyls. Thanks to the stability of phenolate ion, deprotonation is favored (ca. pKa 10). In despite of the structure of the coordination compound formed cannot be established by means of MS, for our here assessment, the production of a [(GlcGA10)Fe]- (Figure 9) is chemically feasible and compatible for explain the principal signals in the spectra of Figure 8.
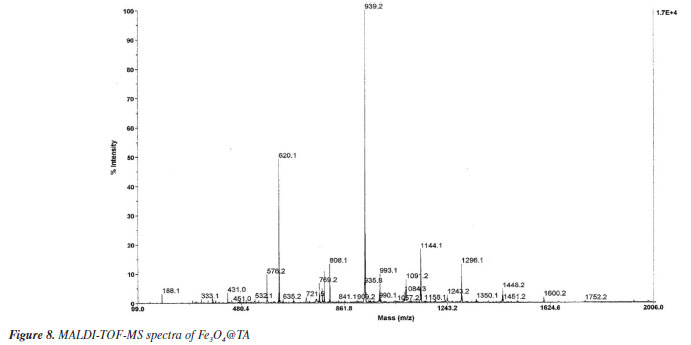
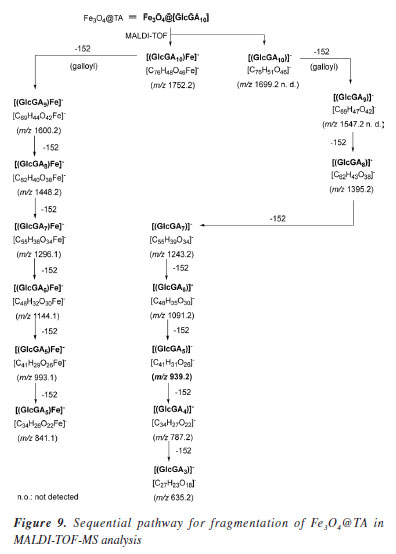
These insights lead us into a decomposition pathway to explain some of the peaks that appears in the spectra of Figure 8. The molecular ion [(GlcGA10)Fe]- readily produced by the loss of four protons and coordination with iron(III), undergoes into consecutive ester linkage breaks to release galloyl (152 molecular mass) fragments. As a result, a small signal at m/z 1600.2 is noticed which corresponds to [(GlcGA9)Fe]- (Figure 9) as denoted ion. In the present pathway, the oncoming loss of galloyl fragments was expected. Indeed, the sequentially loss of 2, 3, 4, 5, 6 galloyl units yield the ions with m/z 1448.2, 1296.1, 1144.1, 993.1 respectively, until tetragalloyl-glucose at m/z 841.1 (Figure 9). The m/z 620.1 fragment was assigned to a coordination compound formed by iron and three CHA molecules (CHA-Fe, C30H18N3O9Fe), where CHA (α-cyano-4-hydroxycinnamic acid) functions as the MALDI-TOF matrix. It is well established that CHA can coordinate with metal ions to form cluster derivatives, and the fragments corresponding to [3M] (M = CHA fragment) complexes are commonly observed in MALDI-TOF spectra. In our study, CHA effectively chelates the iron ions released from the magnetite core, a phenomenon that has been documented in a previous investigation.27 On the other hand, affinity of iron ions for bidentate aromatic carboxylates results in stable coordination compounds as expected.28 These studies have demonstrated the capability of CHA to form stable metal clusters, supporting the assignment of the m/z 620.1 fragment to a CHA-Fe coordination compound. Another consequence of the galloyl sequential loss approach is the presence of iron free galloyl-glucose derivatives. The direct ionization of Fe3O4@TA into [GlcGA10]- which caused the loss of one and two galoyl fragments, was considered possible, although it was not detected. However, the so expected octagalloyl-glucose [(GlcGa8)]- (m/z 1395.2) shows consistent mass loss of galloyl moieties to heptagalloyl-glucose (m/z 1243.2), hexagalloyl-glucose (m/z 1091.2), pentagalloyl-glucose (m/z 939.2), tetragalloyl-glucose (m/z 787.2) and trigalloyl-glucose (m/z 635.2); being [GlcGA5]- the most abundant product ion. For additional information, see Supplementary Material where Table 1S shows the mass error and m/z from formula of the present study and Figure 1S depicts the complementary MALDI-TOF-MS spectrum. In this regard, the MALDI-TOF analysis demonstrates the integrity of the TA layer on the magnetite nanoparticles and its affinity by the ionized iron species. CdII and PbII adsorption assays To describe a sorption process for the system were Fe3O4@TA is the sorbent, several batch experiments were conducted, in which, solutions of variable concentration of CdII and PbII were treated with an amount of sorbent. Figure 10 depicts the impact of pH on the sorption of CdII and PbII. It was evident that the removal efficiency of both CdII and PbII experienced a significant increase from pH 3.0 to pH 6.0 for CdII, and up to a maximum sorption level at pH 6.0 for both PbII and CdII. Following this, the sorption of these metals sharply declined. This can be explained by the fact that at low pH levels, the surface of Fe3O4@TA was surrounded by hydronium (H3O+) ions, leading to a reduction in the interaction between CdII and PbII with the adsorption sites of Fe3O4@TA due to repulsive forces. Consequently, the adsorption capacity decreased at lower pH levels.
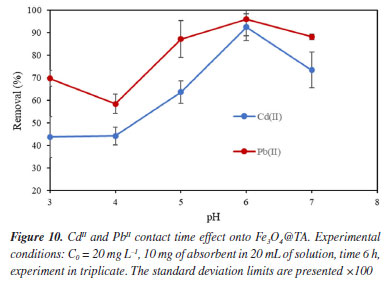
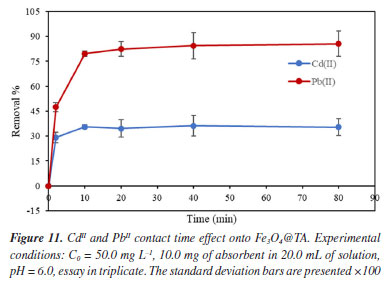
As the pH increased, the competitive influence of hydronium ions decreased, making more ligands available for the adsorption of CdII and PbII. This indicates that, at slightly higher pH values, the overall surface charge of Fe3O4@TA became more negative, resulting in greater adsorption. The increase in the adsorption of CdII and PbII onto Fe3O4@TA as the pH of the solution rises can also be explained by the enhanced dissociation of surface hydroxyl groups from the Fe3O4@TA surface. This leads to the formation of metal ion species like CdOH+, Cd(OH)2, PbOH+, Pb(OH)2, and Pb(OH)42-, which are of low solubility and contribute to the maximized removal of metal ions at certain pH levels.29 However, at high pH values beyond 7.0, the sorption recovery decreased. This phenomenon can be attributed to the structural changes in TA; its hydrodynamic diameter decreased, likely due to the unfolding of molecular conformations.30 This unfolding could result in an unfavorable interaction with metal ions by steric effects, leading to a reduction in sorption capacity. Figure 11 illustrates the impact of contact time on the sorption process of Fe3O4@TA. Notably, it was observed that the rate of metal uptake exhibited a rapid increase within the initial 5 min of contact time. Subsequently, after approximately 10 min, this rate started to decrease until a constant metal concentration was achieved. The attainment of this equilibrium metal concentration was observed at around 20 min for both PbII and CdII. This timeframe was deduced to signify the point of equilibrium, at which the metal concentration in the system remained constant.
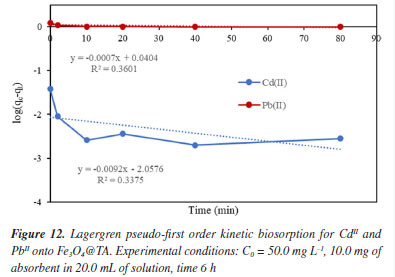
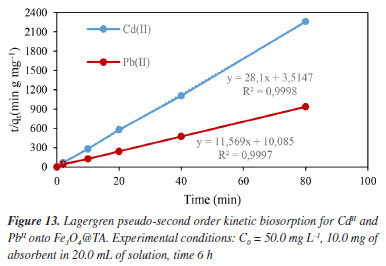
In Figures 12 and 13, the linear plots of log(qe-qt)versust are presented for the Lagergren pseudo-first order model, and t/qt versust for the Lagergren pseudo-second order model regarding the biosorption of CdII and PbII using Fe3O4@TA as sorbent. The pseudo-second order equation exhibited a solid fit to the experimental data, with a high correlation coefficient (R2) close to unity (Figure 13), in contrast to the first-order model (Figure 12). The slight deviation from the straight line within the initial 30 min of sorption (Figure 12), as observed for the pseudo-first order model, was attributed to the rapid initial uptake of PbII and CdII onto Fe3O4@TA followed by a slower adsorption process. Based on the correlation coefficients, it can be concluded that the sorption of CdII and PbII by the Fe3O4@TA nano-sorbent follows a global second-order reaction pathway.31 The later kinetic model gave an equilibrium rate constant (k2, Equation 4) of 0.0194 g mg-1 min-1 for CdII and 0.0134 mg-1 min-1 for PbII.
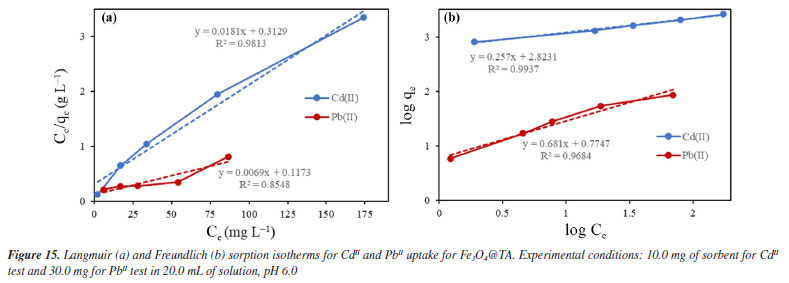
The results shown in Figure 14 refers to the change of concentration of the diluted metal ions presented as the removal (%) when the Fe3O4@TA is used. A progressive decrease in the removal percentage was observed as function of the increase concentration of contaminants in both cases. This is expected since the sorbent is promptly saturated by the sorbate with increasing concentration. If Ce versus qe (Equation 1) is plotted, a higher affinity for PbII is advised as a fact of the maximum qe for PbII against CdII. Given that the sorption capacity is directly influenced by the saturation of the adsorbent, it was deemed appropriate to increase the quantity of nanoparticles utilized for the PbII.
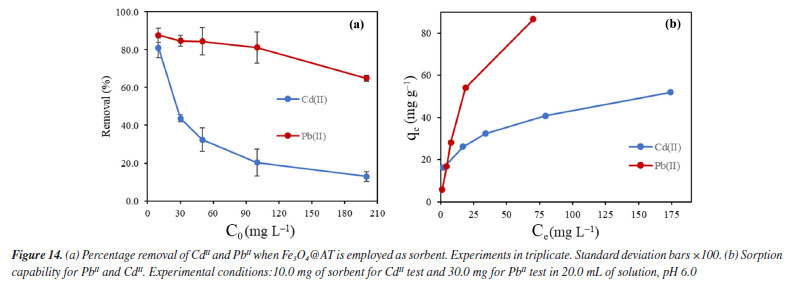
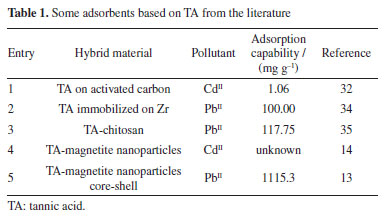
This behavior is directly related to the complex surface chemistry evidenced by FTIR, where a variety of active sites on the TA coating are available for binding. The Langmuir model yielded a maximum adsorption capacity (qm) of 55.2 mg g-1, a value that reflects the moderate but selective affinity of the nanocomposite for CdII. The adsorption isotherms for PbII exhibited a much higher maximum adsorption capacity (qm = 322 mg g-1 from the Langmuir model), reflecting a stronger interaction of PbII with the Fe3O4@TA surface. In comparison, a sorbent based on TA immobilized onto activated carbon with sorption capability of32 1.06 mg g-1 for CdII and the novel adsorbent denominated as self-assembled metal-phenolic networks prepared with tannic acid and ferric ions, showed a maximum adsorption capacity of 356.1 mg g-1.33 Some of recent advances on novel sorbents are depicted in Table 1.
Despite the TA-magnetite core-shell adsorbent demonstrating the highest adsorption capacity (entry 5, Table 1), its synthesis exhibits several drawbacks. The protocol necessitates the use of a corrosive precursor, FeCl3, and requires additional solvents such as ethylene glycol, along with prolonged thermal treatment at 200 ºC for 24 h versus ultrasound shorter process. Furthermore, the resulting hybrid material has a mean particle size exceeding ca. 500 nm, which may limit its applicability in systems where nanoscale dimensions are advantageous. The good adsorption capability, favorable pH-dependent adsorption, and multilayer uptake of CdII can be directly linked to well-defined nanostructure of the nanocomposite, as observed by SEM and TEM, and the active, TA-derived binding sites confirmed by FTIR and MALDI-TOF. The TGA analysis further supports the stability and presence of the organic layer essential to the adsorption process. It was noted that the elevated removal percentage and sorption capability observed for PbII are linked to the greater mass of adsorbent used for this metal. Similar findings were reported by Qiu et al.,33 who attributed the exceptional adsorption performance of TA to the strong coordination interactions between PbII and phenolic hydroxyl groups, ester functionalities, as well as the specific affinity of TA for PbII.34 To gain a deeper understanding of the sorption mechanism, we applied the Langmuir and Freundlich models. Analyzing the data from Equations 5 and 6, we constructed linear plots, and these are presented in Figure 15. Comprehensive data from both models are listed in Table 2. Notably, the sorption process aligns more effectively with the linear form of the Freundlich equilibrium isotherm, depicted in Figure 15b. This yielded R2 values of 0.9937 and 0.9684 for CdII and PbII, respectively.
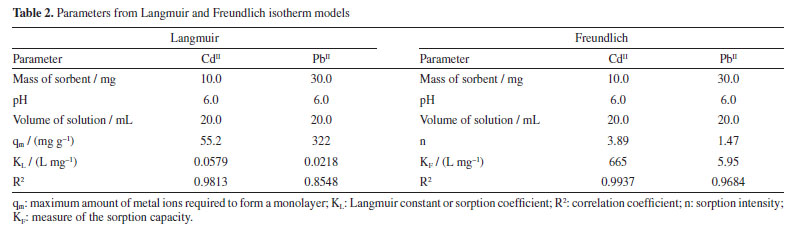
From this, we can deduce that the exclusive assumption of a homogeneous monolayer adsorption mechanism, as suggested by the Langmuir isotherm, may be inaccurate for surface sorption of metal ions.36 The Langmuir model assumes equal affinity for the adsorbate across all binding sites, limitation to monolayer formation, non-exceedance of the number of adsorbed species beyond total surface sites, and no lateral interactions between adsorbed species. These assumptions, particularly in adsorbate based on biomolecules, may hold untrue. Hence, the Freundlich better fit the data, accounting for non-identical adsorption binding. This alignment was expected since TA, being a polyphenolic macromolecule, possesses non-homogeneous binding sites for the adsorbate. Notably, the sorption intensity "n" (Equation 6) for both CdII and PbII sorption exceeded 1, indicating a favorable process.
CONCLUSIONS A successful synthesis of a hybrid nanomaterial was achieved through the integration of magnetite nanoparticles (MNPs) with tannic acid. The modification of the bare MNPs with TA using ultrasound treatment proved to be effective according to UV-Vis spectroscopy analysis. The resultant biobased nanomaterial exhibited nano-scale dimensions according to SEM and TEM analysis and demonstrated remarkable dispersibility in water provided by the TA presence, and its integrity demonstrated by MALDI-TOF analysis. This attribute is particularly advantageous as it fulfills the requisites for efficient dispersion, and retrieval of a water pollutant adsorbent, all achievable at room temperature, shown by DLS analysis. In summary, this nanomaterial is an efficient and environmentally compatible solution for water purification. The study effectively demonstrated that the post-synthesis functionalization approach involves the initial synthesis of MNPs followed by the surface modification with TA-yielded magnetic nanoparticles in an ultrasonic regimen. Notably, this surface modification procedure did not necessitate supplementary solvents, reinforcing the eco-friendliness of the method. Moreover, ultrasound was harnessed to facilitate the surface modification process, further bolstering the ecological nature of the technique. The utilization of the Freundlich model in the analysis of adsorption isotherms demonstrates the existence of non-identical adsorption binding sites, a phenomenon that aligns well with the distinct characteristics of TA. The sorption process of CdII and PbII onto Fe3O4@TA thus appears to be complex and favorable, with numerous binding sites contributing to the overall mechanism. Notably, the adsorption process could be accomplished within a mere 20 min, a time-saving advantage with great potential for various applications, water decontamination inclusive.
SUPPLEMENTARY MATERIAL Complementary material for this work is available at http://quimicanova.sbq.org.br/, as a PDF file, with free access.
DATA AVAILABILITY STATEMENT All data are available in the text..
ACKNOWLEDGMENTS The authors would like to express their gratitude to C. A. Angulo Pachón from Universitat Jaume I for his invaluable assistance in obtaining the results presented in this study. Secondly, we extend our thanks to Universidad del Tolima for providing financial support for this research. The authors also acknowledge the members of the QUAPE laboratory for their valuable contributions to the project. Special thanks are extended to C. C. Villa from Quindío University for his advising and guidance to C. E. G. Henao.
REFERENCES 1. Ahmad, A.; Azam, T. In Bottled and Packaged Water; Grumezescu, A. M.; Holban, A. M., eds.; Woodhead Publishing: Oxford, 2019, p. 83. [Crossref] 2. Horst, M. F.; Alvarez, M.; Lassalle, V. L.; Sep. Sci. Technol. 2016, 51, 550. [Crossref] 3. Baruwati, B.; Polshettiwar, V.; Varma, R. S.; Tetrahedron Lett. 2009, 50, 1215. [Crossref] 4. Khan, A. H.; Khan, N. A.; Zubair, M.; Shaida, M. A.; Manzar, M. S.; Abutaleb, A.; Naushad, M.; Iqbal, J.; Environ. Res. 2022, 204, 112243. [Crossref] 5. Da'na, E.; Microporous Mesoporous Mater. 2017, 247, 145. [Crossref] 6. Yantasee, W.; Rutledge, R. D.; Chouyyok, W.; Sukwarotwat, V.; Orr, G.; Warner, C. L.; Warner, M. G.; Fryxell, G. E.; Wiacek, R. J.; Timchalk, C.; Addleman, R. S.; ACS Appl. Mater. Interfaces 2010, 2, 2749. [Crossref] 7. Yang, X.; Wan, Y.; Zheng, Y.; He, F.; Yu, Z.; Huang, J.; Wang, H.; Ok, Y. S.; Jiang, Y.; Gao, B.; Chem. Eng. J. 2019, 366, 608. [Crossref] 8. Das, J.; Saha, R.; Nath, H.; Mondal, A.; Nag, S.; Environ. Sci. Pollut. Res. 2022, 29, 86528. [Crossref] 9. Cruz, B. H.; Díaz-Cruz, J. M.; Ariño, C.; Esteban, M.; Electroanalysis 2000, 12, 1130. [Crossref] 10. Slabbert, N. In Plant Polyphenols; Hemingway, R. W.; Laks, P. E., eds.; Springer: Boston, 1992, p. 421. [Crossref] 11. Rane, A. V.; Kanny, K.; Abitha, V. K.; Thomas, S. In Synthesis of Inorganic Nanomaterials; Bhagyaraj, S. M.; Oluwafemi, O. S.; Kalarikkal, N.; Thomas, S., eds.; Woodhead Publishing: Duxford, 2018, p. 121. 12. Omoike, A. In Nanoparticles: Synthesis, Stabilization, Passivation, and Functionalization; Nagarajan, R.; Hatton, T. A., eds.; ACS Publications: Washington, 2008, ch. 8. [Crossref] 13. Luo, H.; Zhang, S.; Li, X.; Liu, X.; Xu, Q.; Liu, J.; Wang, Z.; J. Taiwan Inst. Chem. Eng. 2017, 72, 163. [Crossref] 14. Bagtash, M.; Yamini, Y.; Tahmasebi, E.; Zolgharnein, J.; Dalirnasab, Z.; Microchim. Acta 2016, 183, 449. [Crossref] 15. Guarnizo, A.; Angurell, I.; Muller, G.; Llorca, J.; Seco, M.; Rossell, O.; Rossell, M. D.; RSC Adv. 2016, 6, 68675. [Crossref] 16. Boo, H. O.; Hwang, S. J.; Bae, C. S.; Park, S. H.; Heo, B. G.; Gorinstein, S.; Ind. Crops Prod. 2012, 40, 129. [Crossref] 17. Galvão, M. A. M.; de Arruda, A. O.; Bezerra, I. C. F.; Ferreira, M. R. A.; Soares, L. A. L.; Braz. Arch. Biol. Technol. 2018, 61, e18170586. [Crossref] 18. Bodelón, G.; Costas, C.; Pérez-Juste, J.; Pastoriza-Santos, I.; LizMarzán, L. M.; Nano Today 2017, 13, 40. [Crossref] 19. Wu, C. X.; Wen, S. Z.; Yan, L. K.; Zhang, M.; Ma, T. Y.; Kan, Y. H.; Su, Z. M.; J. Mater. Chem. C 2017, 5, 4053. [Crossref] 20. Rudolph, M.; Erler, J.; Peuker, U. A.; Colloids Surf., A 2012, 397, 16. [Crossref] 21. Karade, V. C.; Waifalkar, P. P.; Dongle, T. D.; Sahoo, S. C.; Kollu, P.; Patil, P. S.; Patil, P. B.; Mater. Res. Express 2017, 4, 096102. [Crossref] 22. Hansen, T. W.; Delariva, A. T.; Challa, S.; Acc. Chem. Res. 2013, 46, 1720. [Crossref] 23. Clayton, K. N.; Salameh, J. W.; Wereley, S. T.; Kinzer-Ursem, T. L.; Biomicrofluidics 2016, 10, 054107. [Crossref] 24. Kok, C. M.; Rudin, A.; Die Makromolekulare Chemie, Rapid Communications 1981, 2, 655. [Crossref] 25. Lim, J.; Yeap, S. P.; Che, H. X.; Low, S. C.; Nanoscale Res. Lett. 2013, 8, 381. [Crossref] 26. Bahr, U.; Karas, M.; Hillenkamp, F.; Fresenius' J. Anal. Chem. 1994, 348, 783. [Crossref] 27. Smirnov, I. P.; Zhu, X.; Taylor, T.; Huang, Y.; Ross, P.; Papayanopoulos, I. A.; Martin, S. A.; Pappin, D. J.; Anal. Chem. 2004, 76, 2958. [Crossref] 28. Kontoghiorghes, G. J.; Kontoghiorghe, C. N.; Cells 2020, 9, 1456. [Crossref] 29. Sočo, E.; Kalembkiewicz, J.; Chem. Process Eng. 2016, 37, 215. [Crossref] 30. Dultz, S.; Mikutta, R.; Kara, S. N. M.; Woche, S. K.; Guggenberger, G.; Sci. Total Environ. 2021, 754, 142119. [Crossref] 31. Vergis, B. R.; Kottam, N.; Krishna, R. H.; Nagabhushana, B. M.; NanoStruct. Nano-Objects 2019, 18, 100290. [Crossref] 32. Üçer, A.; Uyanik, A.; Aygün, Ş. F.; Sep. Purif. Technol. 2006, 47, 113. [Crossref] 33. Qiu, H.; Ni, W.; Yang, L.; Zhang, Q.; Chem. Eng. J. 2022, 450, 138161. [Crossref] 34. Zou, L.; Shao, P.; Zhang, K.; Yang, L.; You, D.; Shi, H.; Pavlostathis, S. G.; Lai, W.; Liang, D.; Luo, X.; Chem. Eng. J. 2019, 364, 160. [Crossref] 35. Badawi, M. A.; Negm, N. A.; Abou Kana, M. T. H.; Hefni, H. H.; Abdel Moneem, M. M.; Int. J. Biol. Macromol. 2017, 99, 465. [Crossref] 36. Liu, L.; Luo, X. B.; Ding, L.; Luo, S. L. In Nanomaterials for the Removal of Pollutants and Resource Reutilization; Luo, X.; Deng, F., eds.; Elsevier: Netherlands, 2019, ch. 4. [Crossref]
Associate Editor handled this article: Boniek G. Vaz |

On-line version ISSN 1678-7064 Printed version ISSN 0100-4042
Química Nova
Publicações da Sociedade Brasileira de Química
Caixa Postal: 26037
05513-970 São Paulo - SP
Tel/Fax: +55.11.3032.2299/+55.11.3814.3602
Free access